Blog Analytics, growth and chat, explained with real numbers · Page 4
Practical notes from the team building TapCub: how metrics are defined, where funnels break, what AI crawlers take from your site, and how support teams turn conversations into conversions.
Browse every article
Filter by category or search a keyword. Every article links to the report or setting it talks about.
230 articles · page 4 of 5
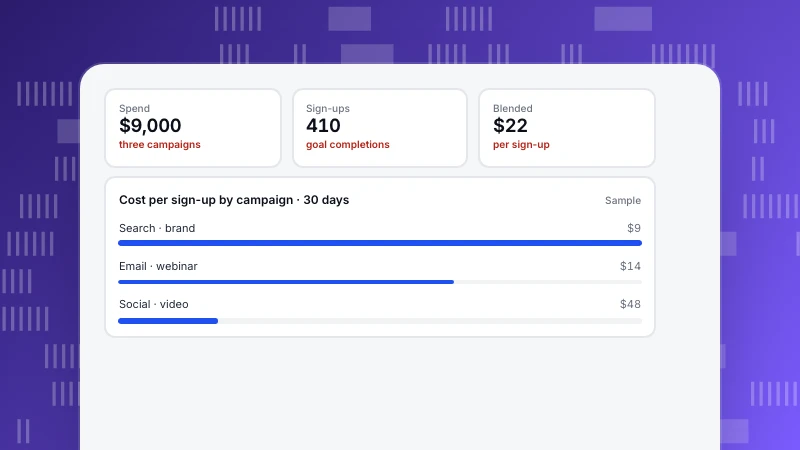
Marketing Campaign Analysis: A Six-Step Method With an Example
How to analyse a marketing campaign: set the goal, tag the links, check traffic arrived, measure outcomes, compare campaigns per outcome and decide. A sample comparing three campaigns.
Read more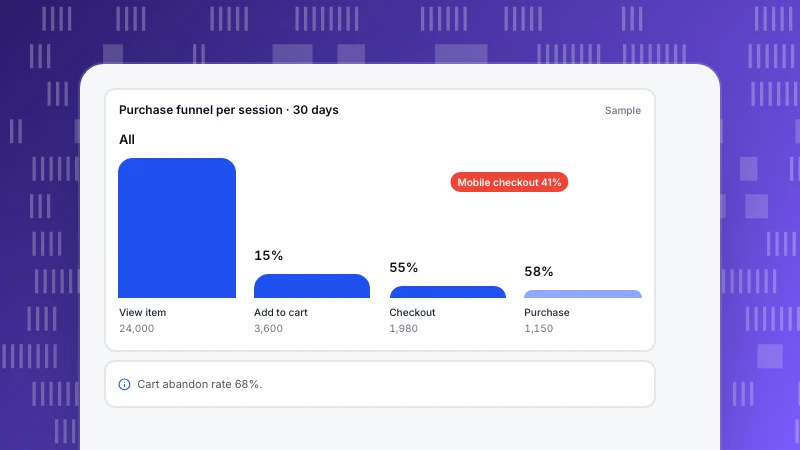
Purchase Path: How Shoppers Get to Checkout and Where They Drop
The purchase path is the sequence of steps from first interest to a completed order. The stages, the events that make it measurable online, a sample per-session funnel, and how to fix the biggest leak.
Read more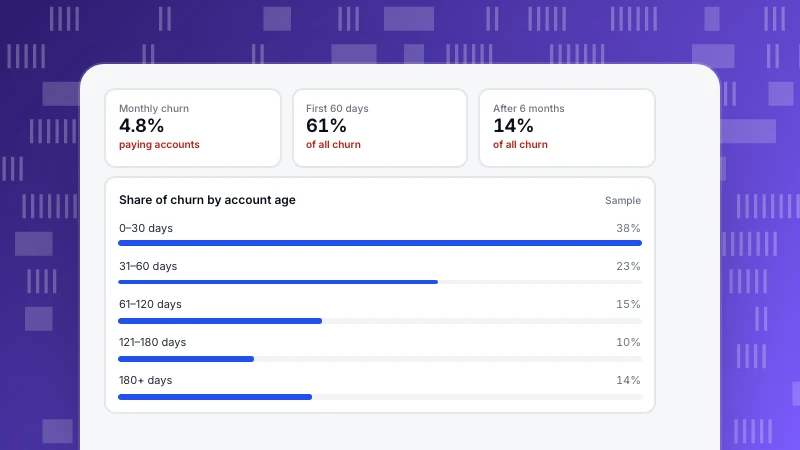
Customer Churn Analysis: A Five-Step Method With an Example
Customer churn analysis finds who leaves, when, and after what. A five-step method you can run with ordinary event data, the behaviour signals to compare, and a sample that leads to a concrete fix.
Read more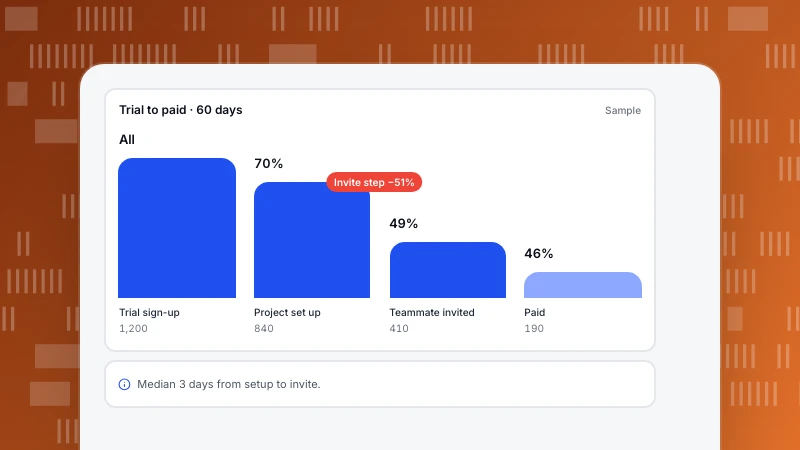
Customer Journey Analytics: From Journey Map to Measured Paths
Customer journey analytics measures how people actually move from first visit to purchase and beyond. The four analyses it is built from, which question each answers, and a sample from trial to paid.
Read more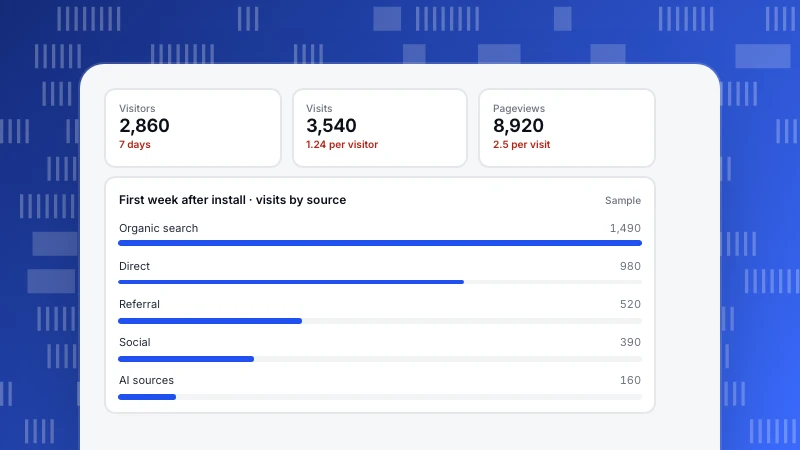
How to Check Website Traffic: Your Own Site and Anyone Else's
How to check traffic on your own website with analytics, which five numbers to read first, how estimates for other sites work and how far to trust them, and why tools never agree.
Read more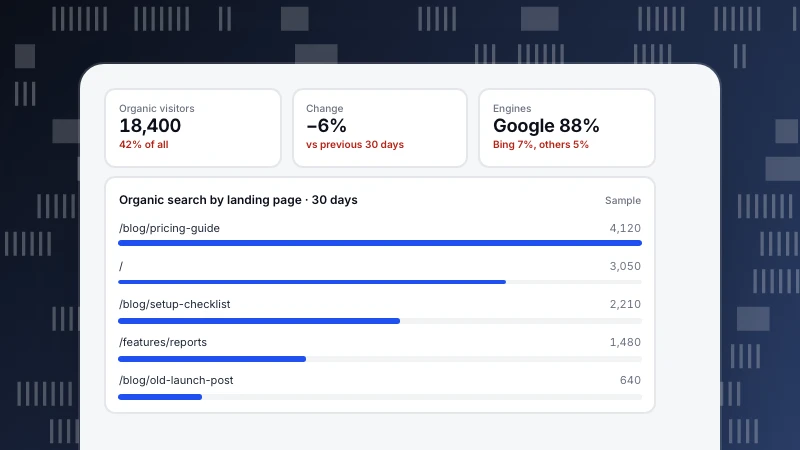
What Is Organic Traffic? How It Is Counted and How to Grow It
Organic traffic is visits from unpaid search results. How analytics decides a visit is organic, how it differs from paid and direct traffic, a sample breakdown, and a routine for growing it or explaining a drop.
Read more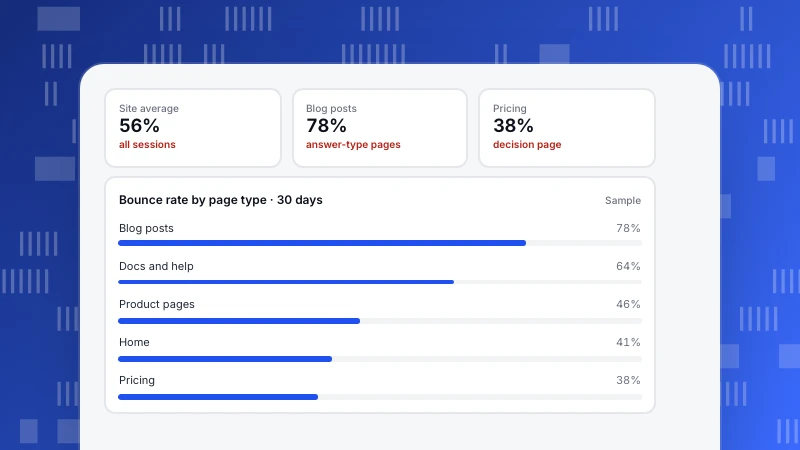
What Is a Good Bounce Rate? Judge It by Page Type, Not One Number
There is no single good bounce rate. What bounce rate measures, why a site-wide average misleads, a sample by page type, when a high rate is a real problem, and how to set your own target.
Read more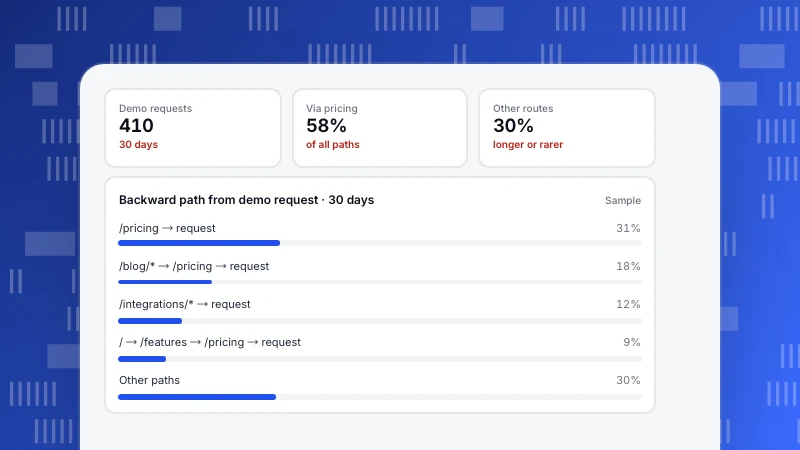
Conversion Paths: Design Them, Then Read the Ones People Actually Take
A conversion path is the route from a first click to a completed goal. The four parts of a designed path with one metric each, and how to read the real paths backward from the goal to find the pages that feed it.
Read more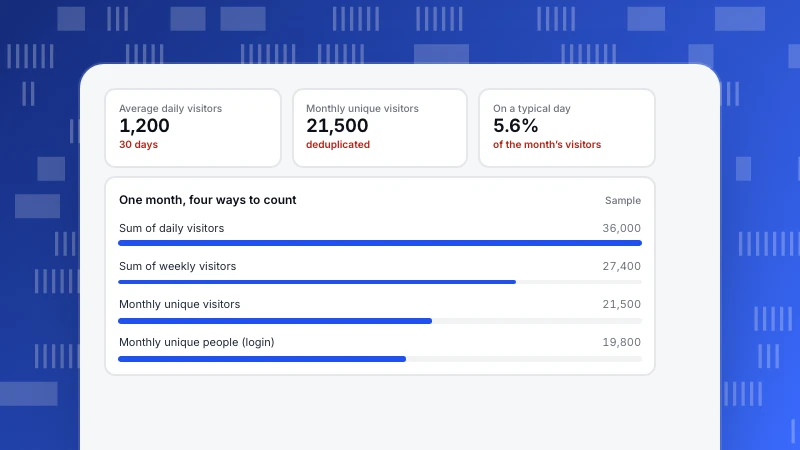
Monthly Unique Visitors: How They Are Counted, and Which Number to Quote
Monthly unique visitors are the distinct people (in practice, browsers or devices) who visited at least once in a month. Why summing days overstates it, how the counting method changes it, and how to report it.
Read more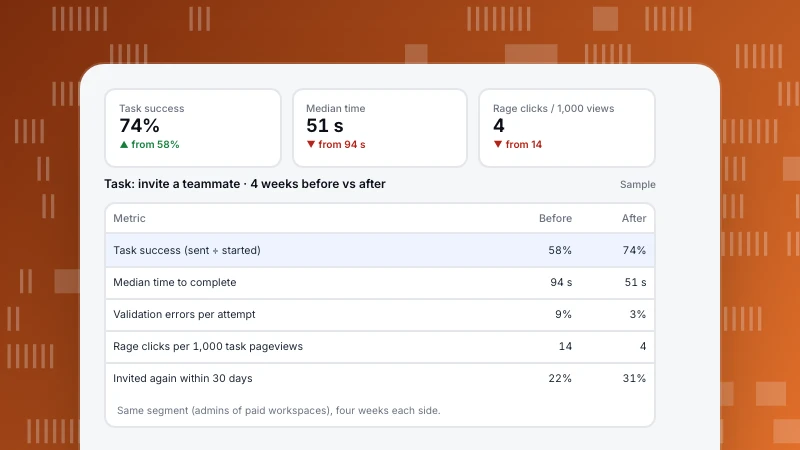
UX Analytics: Measure Whether a Task Got Easier
UX analytics uses behaviour data to measure how easy it is for people to complete tasks in your product or site. Five task metrics, how to define them in events, and a before-and-after example of a redesigned flow.
Read more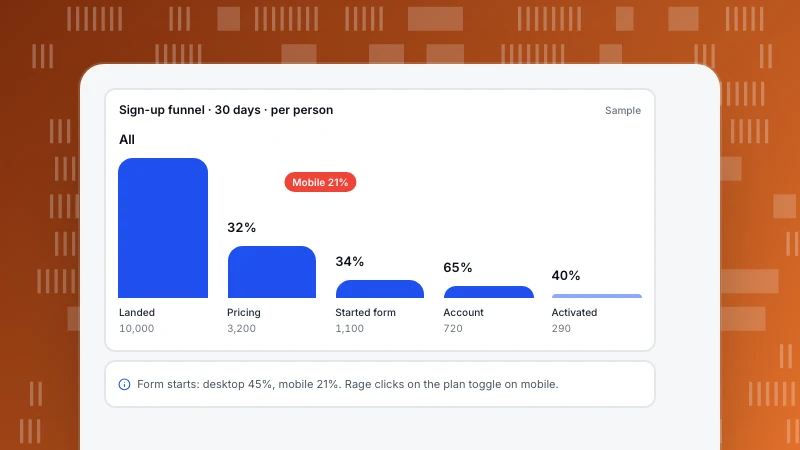
Conversion Funnel Optimization: Pick the Step You Can Move, Not the Biggest Drop
Funnel steps multiply, so a 10% lift on any step adds 10% to the end result. How that changes which step to optimise, a six-step loop from measurement to test, and a worked SaaS sign-up funnel.
Read more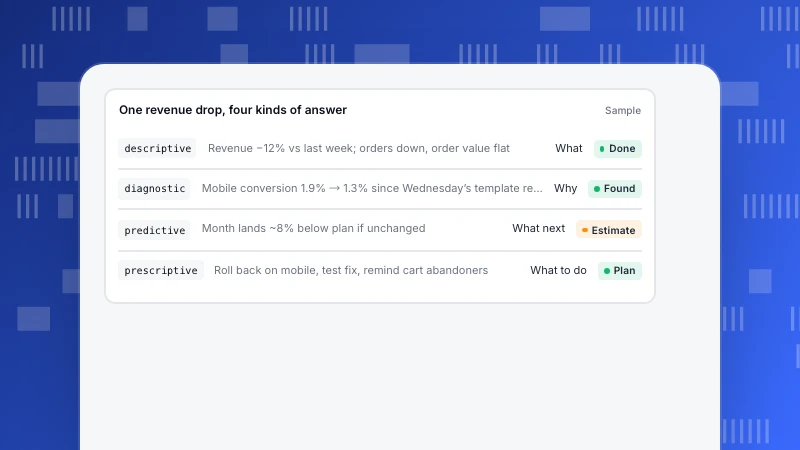
The 4 Types of Data Analytics, Followed Through One Real Question
Descriptive analytics says what happened, diagnostic why, predictive what will happen, and prescriptive what to do. One store’s revenue drop followed through all four, with the method and data each step needs.
Read more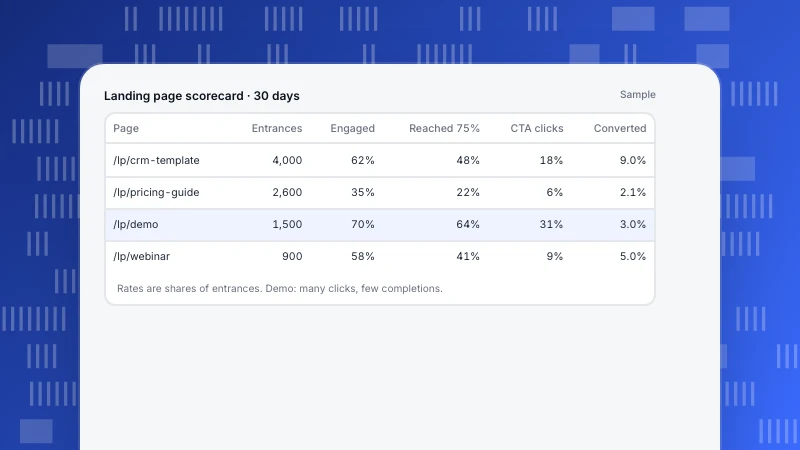
Landing Page Analytics: A Six-Metric Scorecard That Shows Where Visitors Drop
Landing page analytics should tell you where on the page visitors are lost, not just how many converted. Six metrics in page order, a sample scorecard of four pages, and the patterns that point at the fix.
Read more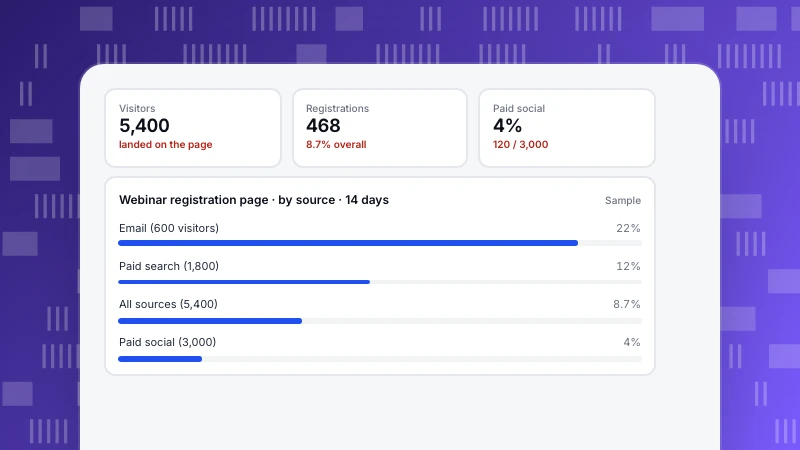
Landing Page Conversion Rate: Calculate It per Source, Then Improve It
Landing page conversion rate is the share of visitors to a landing page who complete its goal. How to calculate it, why one page has a different rate for each traffic source, and a checklist ordered by what usually moves it most.
Read more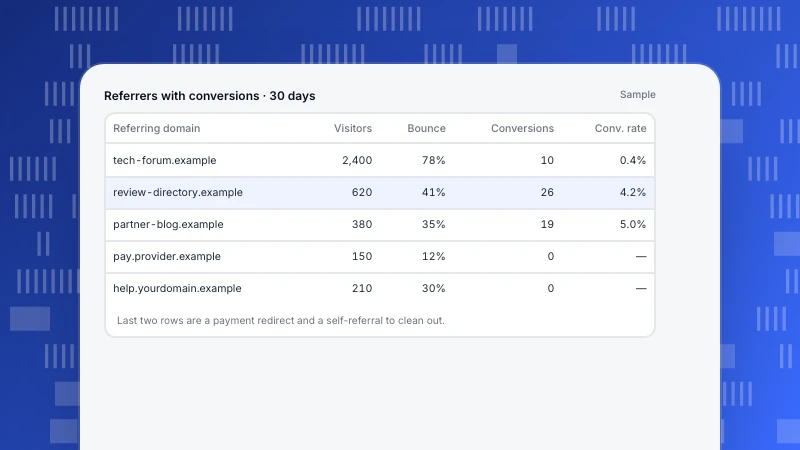
Referral Traffic: What It Is, What Isn’t, and How to Judge It
Referral traffic is visits that arrive by a link on another website. How analytics decides a visit is a referral, the referrers that are not real referrals, and how to judge referring sites by what their visitors do.
Read more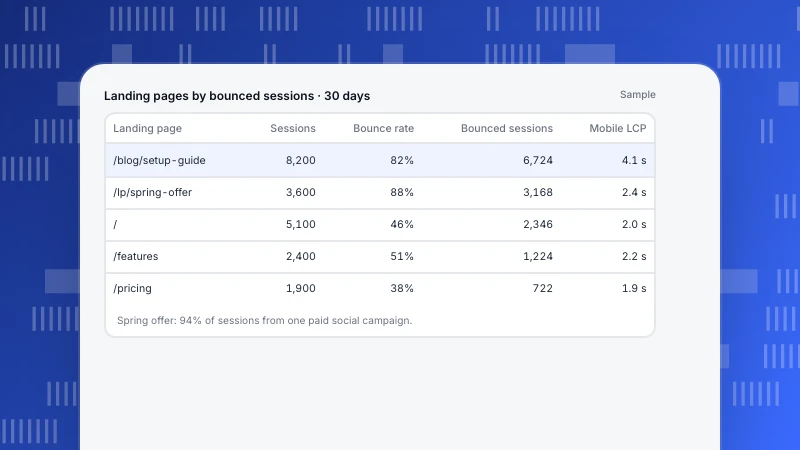
How to Reduce Bounce Rate: Find the Pages That Matter, Then Fix the Cause
Reducing bounce rate starts with knowing what your tool counts as a bounce and which pages lose the most visitors. How to rank landing pages, diagnose the cause by source and device, and apply the fix that matches it.
Read more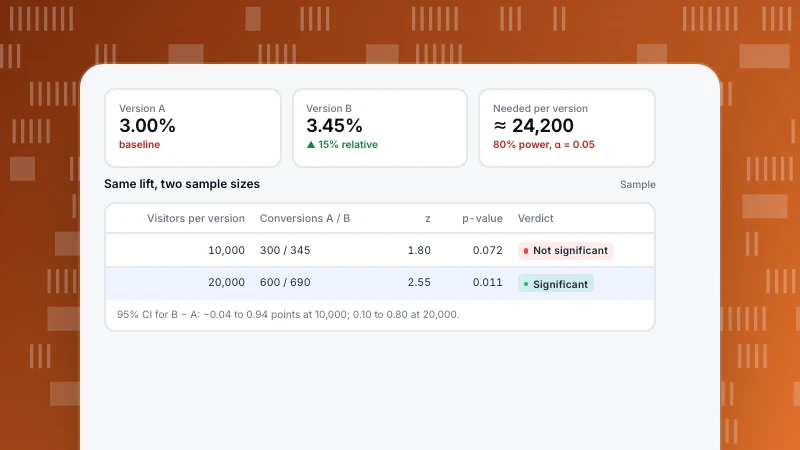
How to Calculate Statistical Significance for an A/B Test
Statistical significance tells you whether a difference between two conversion rates is bigger than chance would usually produce. The five steps of a two-proportion test, a worked example by hand and in code, and how to size the test before you start.
Read more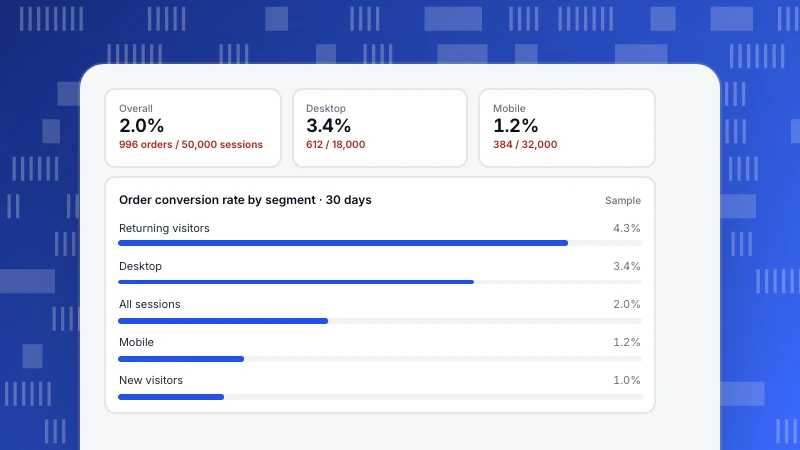
What Is a Good Conversion Rate? How to Judge Yours
A good conversion rate depends on what you count as a conversion, what you divide by, and who your visitors are. Rough ranges by conversion type, the two denominators that change the number, and how to judge your own rate by splitting it.
Read more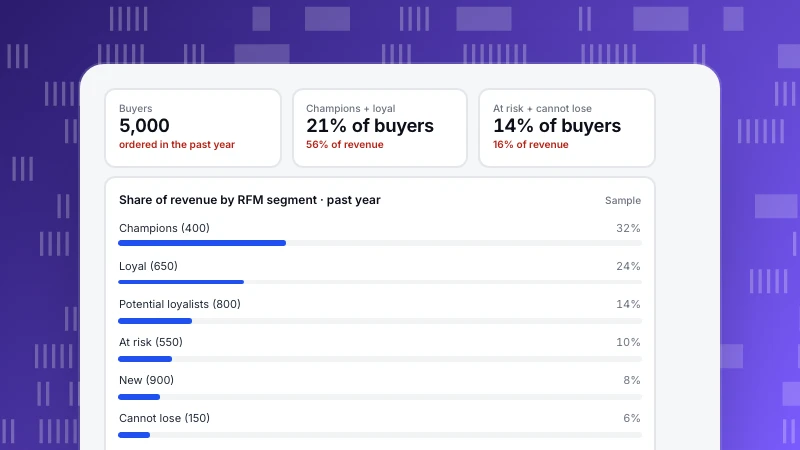
Customer Data Analytics: Five Questions to Answer, With an RFM Example
Customer data analytics turns profile, behaviour and purchase data into decisions about who to win, keep and grow. Five questions to answer, the data each needs, and an RFM example for a store with 5,000 buyers.
Read more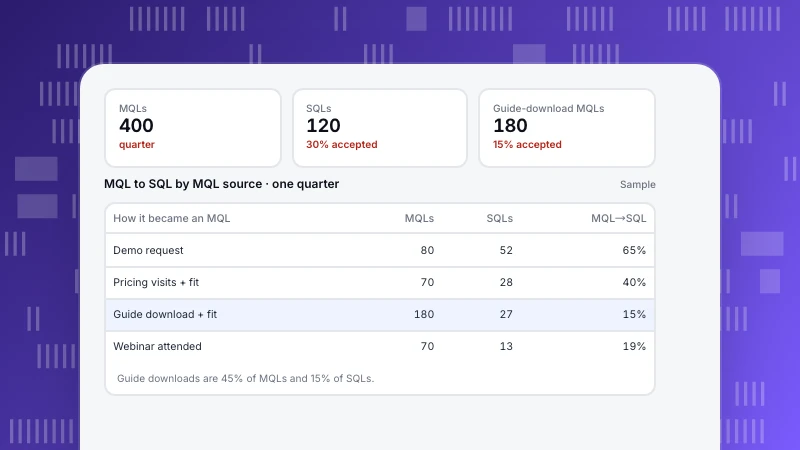
MQL vs SQL: The Difference, and How to Make the Handoff Work
An MQL is a lead marketing judges ready for sales attention; an SQL is a lead sales has accepted as a real buying opportunity. Definitions, a scoring model from fit and behaviour, and MQL-to-SQL rates by source in a worked example.
Read more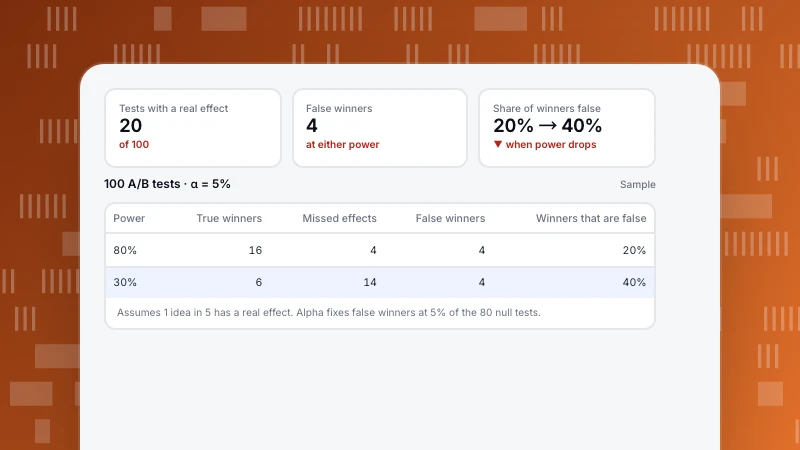
Type 1 vs Type 2 Error: What They Mean for Your A/B Tests
A type 1 error is a false positive: you call a winner that is not real. A type 2 error is a false negative: you miss an effect that is real. A worked set of 100 A/B tests shows how many winners are wrong, and why low power makes it worse.
Read more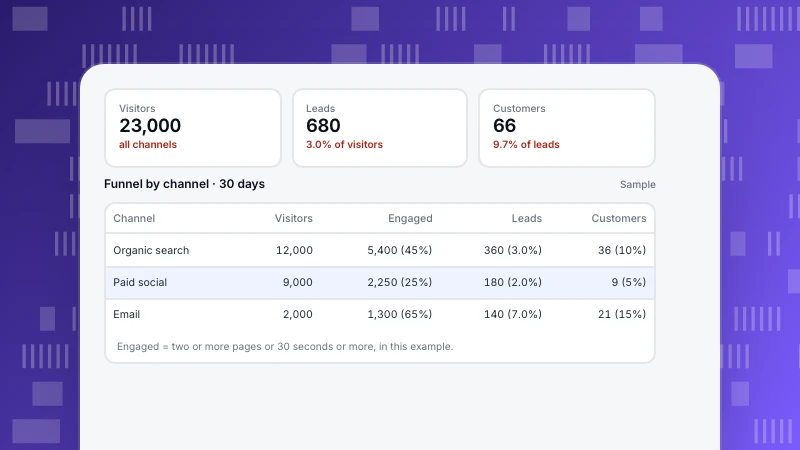
Marketing Funnel: The Stages, and How to Measure Each One
A marketing funnel describes how people move from first hearing about you to buying. The four stages, the metric that belongs to each, a sample funnel split by channel, and the mistakes that make funnel numbers misleading.
Read more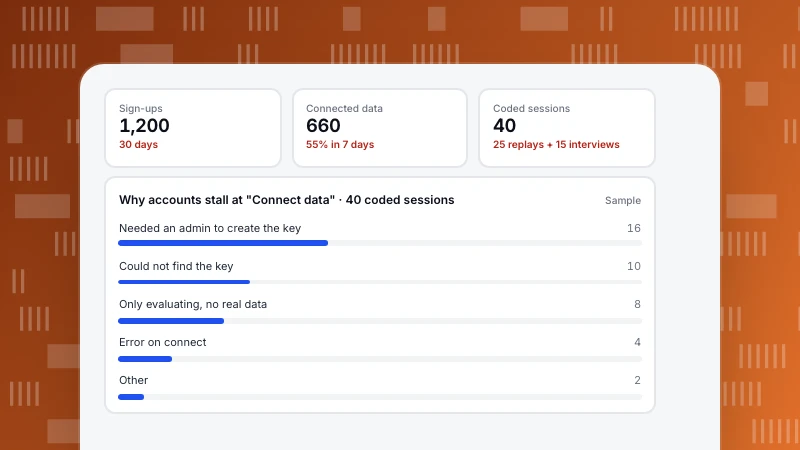
Qualitative vs Quantitative Data: What Each Tells You, and How to Use Both
Quantitative data counts and measures: how many, how often, how much. Qualitative data describes: why, how it felt, what people expected. A comparison table and a product example where numbers find a drop and interviews explain it.
Read more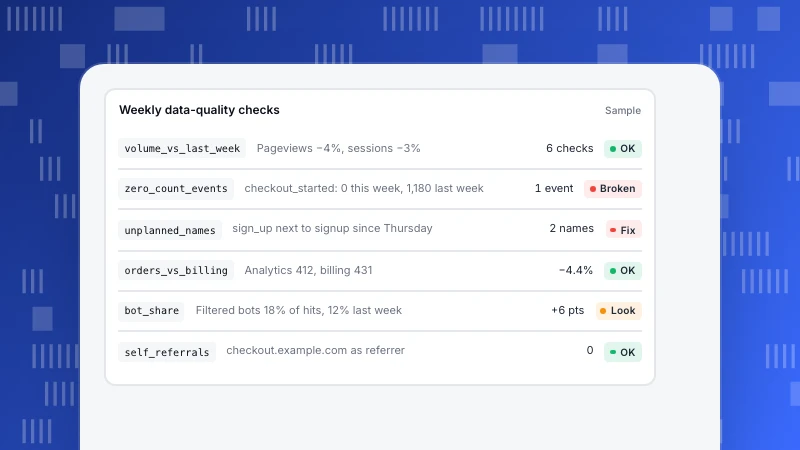
What Is Data Quality? The Six Dimensions, Applied to Analytics Data
Data quality is how far data can be trusted for the decision you want to make. The six dimensions (accuracy, completeness, consistency, timeliness, validity and uniqueness) with the analytics failure each one catches and a weekly check list.
Read more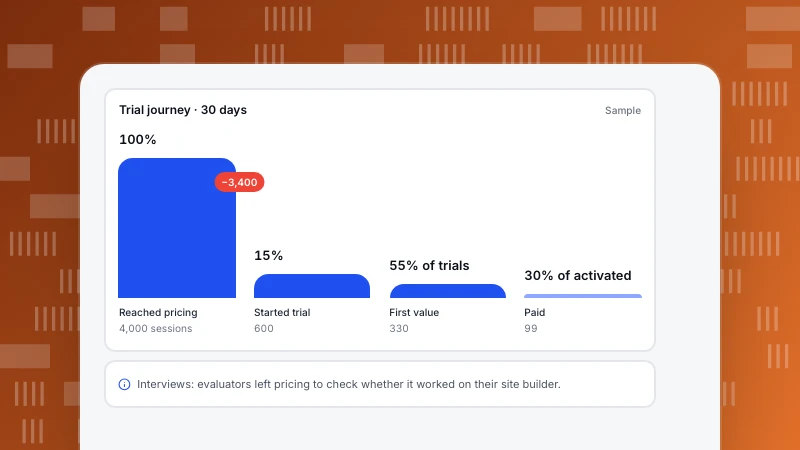
How to Create a Customer Journey Map That Uses Real Data
A customer journey map lays out the stages a customer goes through, what they do and feel at each one, and where they get stuck. Six steps to build one from research and analytics, with a filled-in SaaS example.
Read more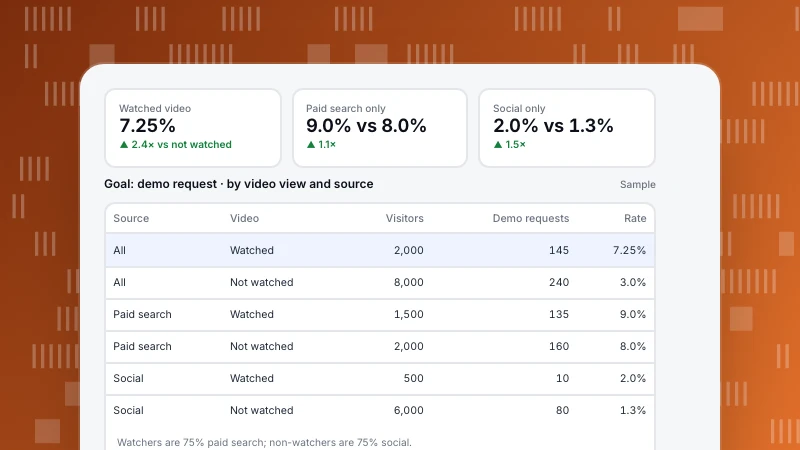
Correlation vs Causation: How to Tell Them Apart in Your Analytics
Correlation means two numbers move together; causation means one makes the other happen. A worked analytics example where a "video triples conversions" claim mostly comes from traffic source, four checks to run on any correlation, and how to test for cause.
Read more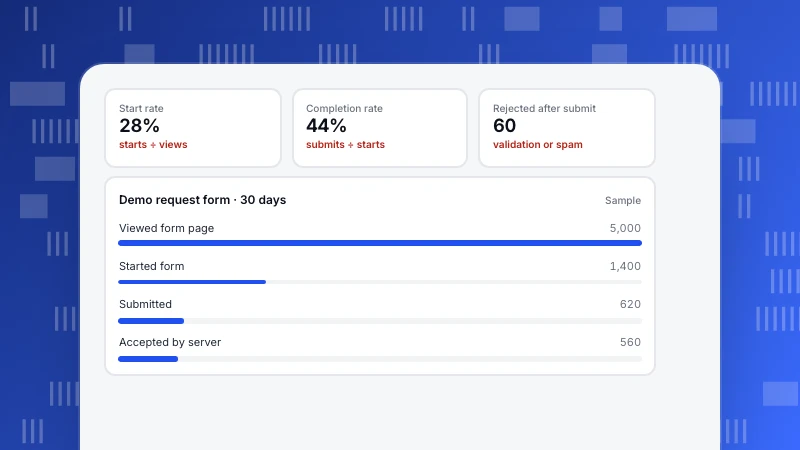
Form Analytics: Measure Where Forms Lose People, Without Recording What They Type
Form analytics shows how many people see a form, start it, submit it and get through. The metrics for each step, how to track starts and validation errors without capturing field values, and what to fix first.
Read more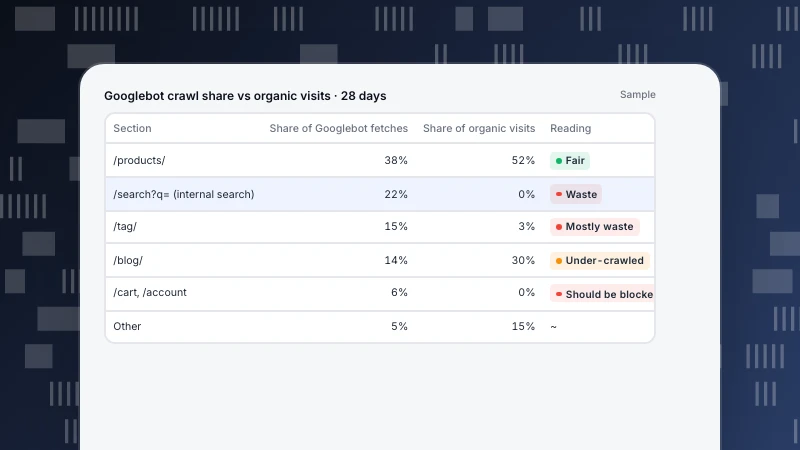
Log File Analysis for SEO: A Tool-Neutral Method in Six Questions
Server logs show what search engine crawlers actually request, not what a crawl tool assumes. How to get the logs, verify that Googlebot is real, and answer six questions that turn raw lines into SEO fixes.
Read more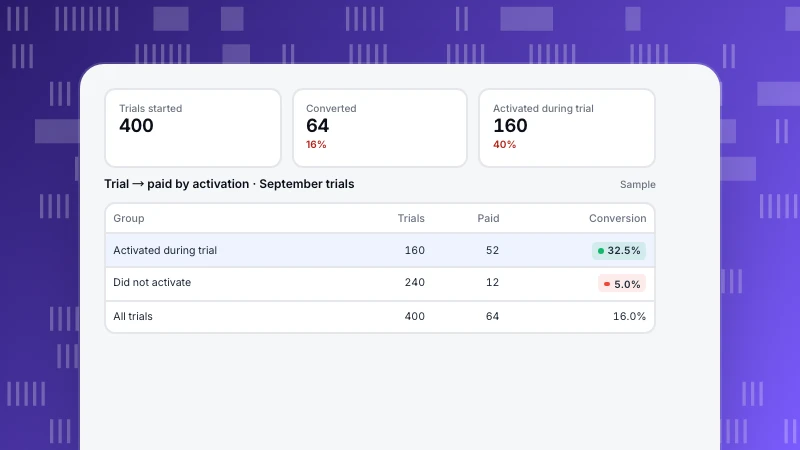
Free Trial Conversion Rate: How to Calculate It and What Moves It
Trial-to-paid conversion looks like a simple ratio, but extensions, early upgrades and different trial types change the answer. How to calculate it by trial-start cohort, and why activation inside the trial is the number that moves it.
Read more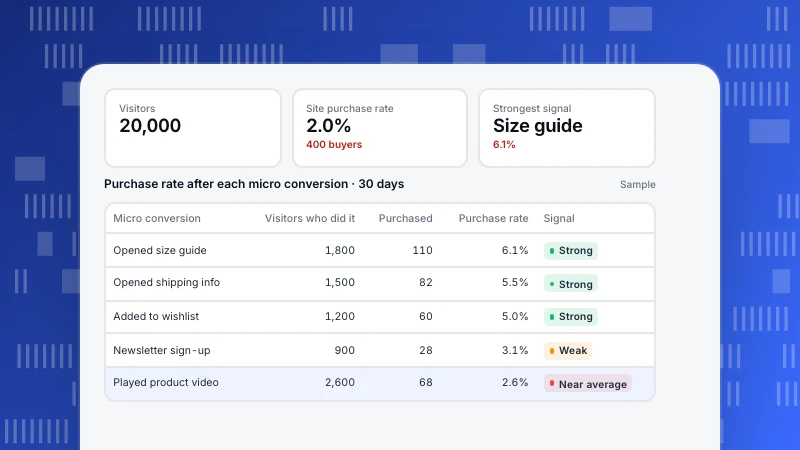
Micro Conversions: How to Pick the Ones That Actually Predict Sales
Micro conversions are small actions on the way to a purchase or lead. They help only if they predict the main conversion. How to pick candidates, test each one against your sales data, track the keepers as goals, and avoid reporting them as success.
Read more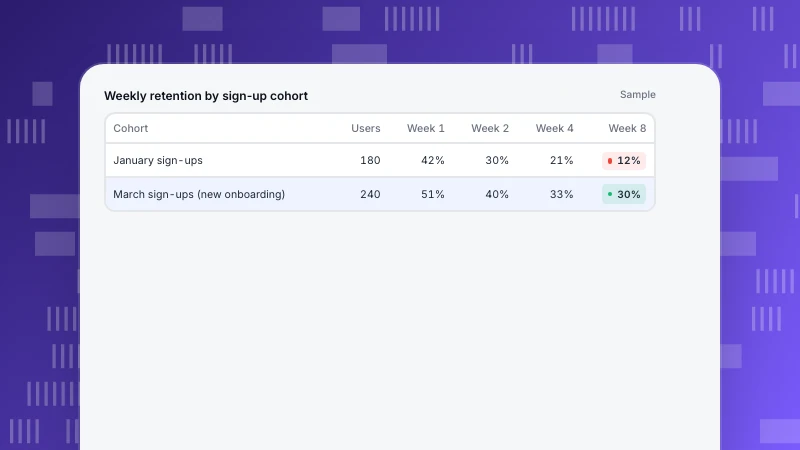
Startup Metrics by Stage: What to Measure Before and After Product-Market Fit
The right startup metrics depend on stage. What to measure before product-market fit, in early traction and in growth, the question each metric answers, the few events to instrument, and why a flattening retention curve matters more than any total.
Read more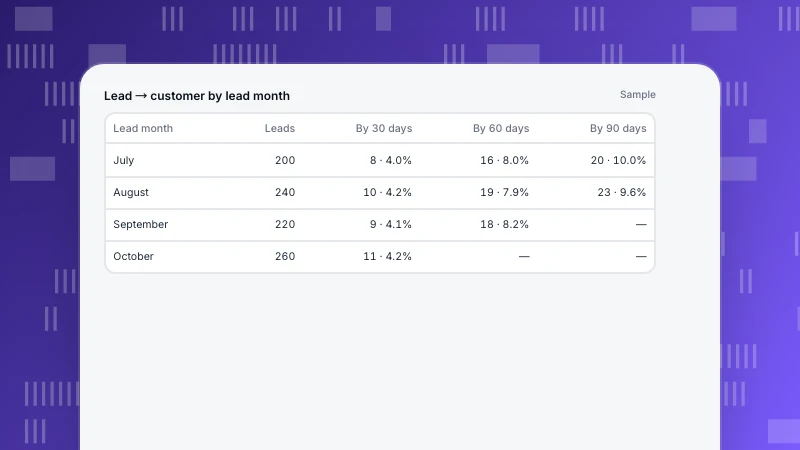
Lead Conversion Rate: Three Formulas and the Cohort Method
"Lead conversion rate" can mean visitor to lead, lead to qualified, or lead to customer. The formula for each, why dividing this month's customers by this month's leads misleads, and how to measure by lead cohort with a fixed window.
Read more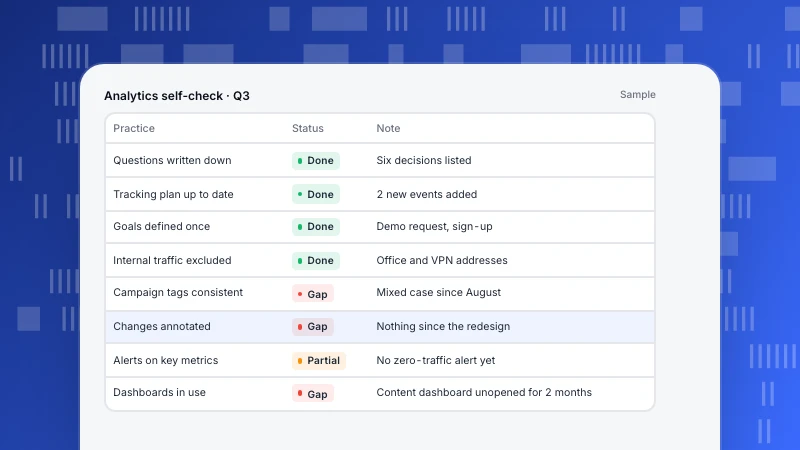
Web Analytics Best Practices: 12 Habits That Keep Data Trustworthy
Twelve web analytics best practices in four groups, plan, collect, read and act, each with a quick way to check you are following it. The habits that keep numbers trustworthy and make sure someone actually uses them.
Read more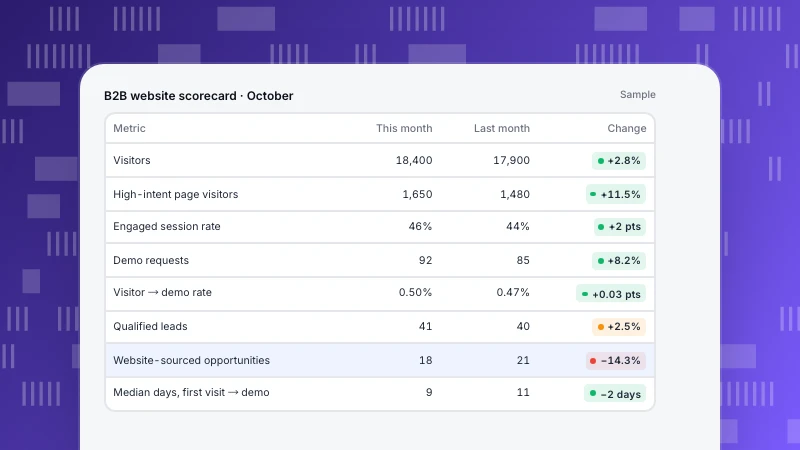
B2B Website Metrics: What to Track From First Visit to Pipeline
B2B buyers research anonymously, in groups, over weeks. The website metrics that reflect that, from high-intent page visits to lead-to-opportunity rate and time to convert, with formulas and a sample monthly scorecard.
Read more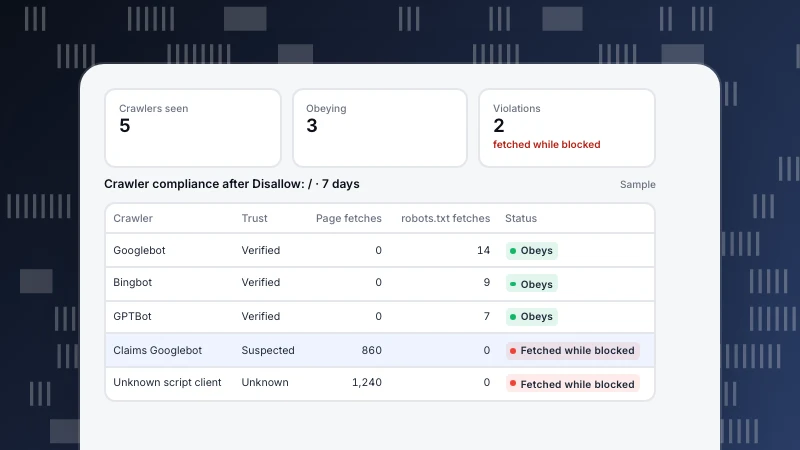
robots.txt Disallow All: What It Blocks, What It Doesn't, and Safer Variants
Two lines in robots.txt ask every crawler to stay off your whole site. What they actually do, what they do not (they do not hide URLs or protect anything), common variants and how Google resolves conflicts, and how to check which crawlers obey.
Read more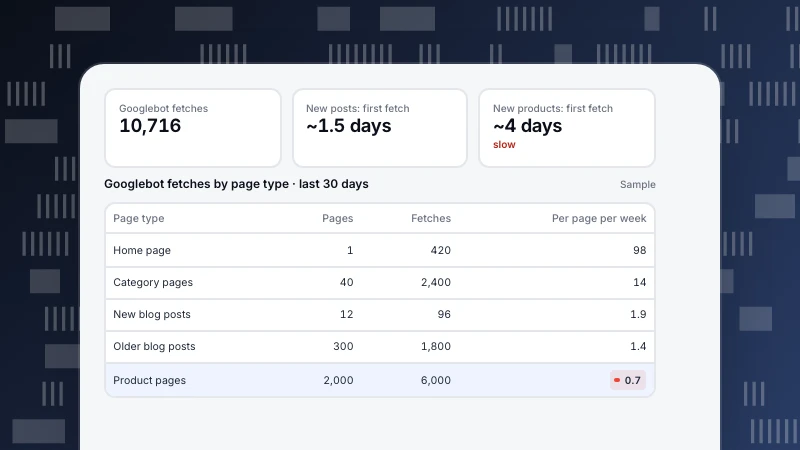
How Often Does Google Crawl a Site? Measure Yours, Then Speed It Up
Google has no fixed crawl schedule: your home page may be fetched many times a day and a deep product page once a month. How to measure crawl frequency on your own site by page type, and what actually gets new pages crawled sooner.
Read more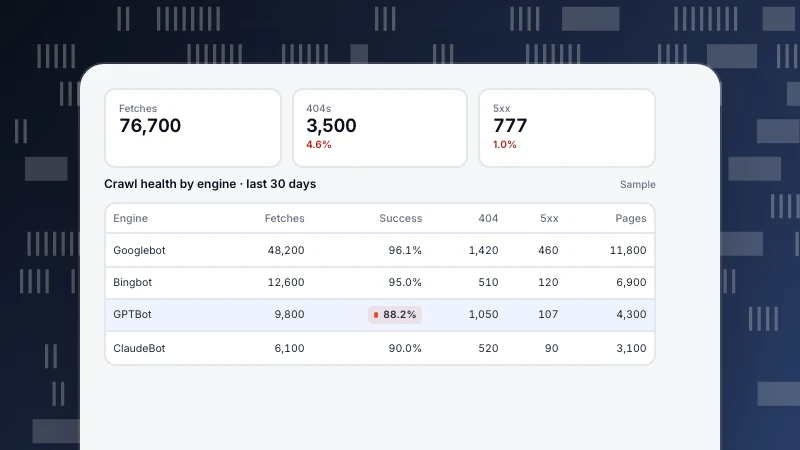
Crawl Budget: Does It Matter for Your Site, and Where Is It Going?
Crawl budget is how much a search engine is willing and able to crawl on your site. When it matters, what wastes it, and how to read server logs to see where search and AI crawlers actually spend their requests.
Read more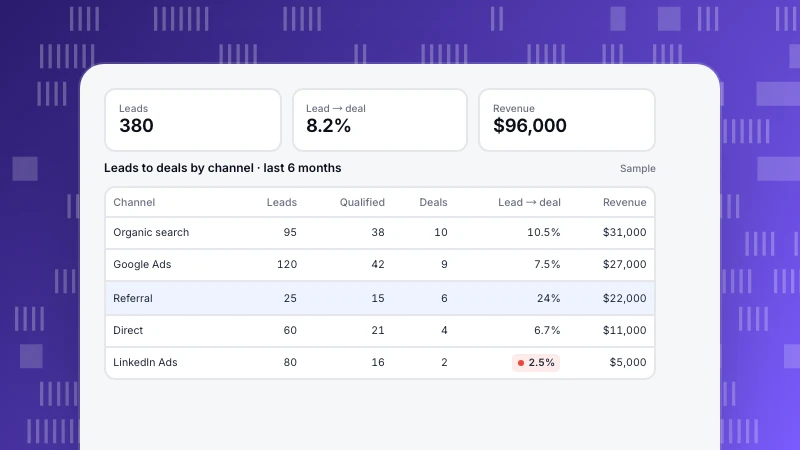
Lead Tracking: From First Visit to Closed Deal, by Channel
Lead tracking connects each lead to where it came from and what happened to it next. How to capture the source on the website, pass it with the form, send qualification and deal stages from your server, and judge channels by deals instead of lead counts.
Read more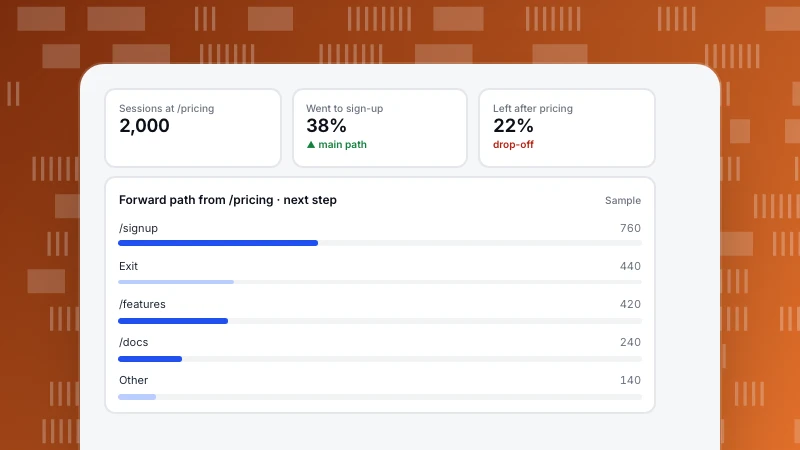
Behavioral Analytics: Five Questions, Five Analyses, and How to Start
Behavioral analytics looks at what people do on your site or product, in what order and how often, rather than how many arrived. Five questions it answers, the analysis for each, what you need tracked, and a one-week plan to start.
Read more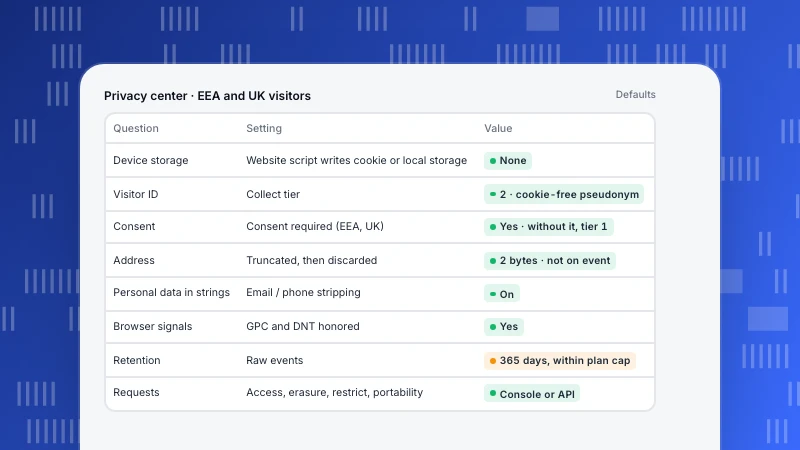
GDPR-Compliant Analytics: A Checklist for Choosing and Setting Up a Tool
No analytics tool is GDPR compliant by itself; compliance depends on what you collect and how you set it up. A checklist of what to check in any tool, tied to the regulation text, with the matching settings in TapCub.
Read more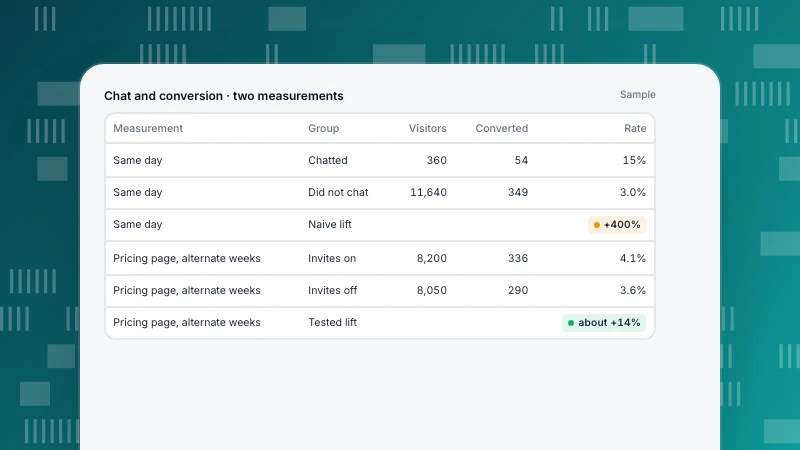
Does Live Chat Increase Conversions? How to Measure It Honestly
Visitors who chat usually convert several times more often, but much of that is who chooses to chat. How to measure live chat's real effect on your site, from a same-day comparison to a time-split test of proactive invites.
Read more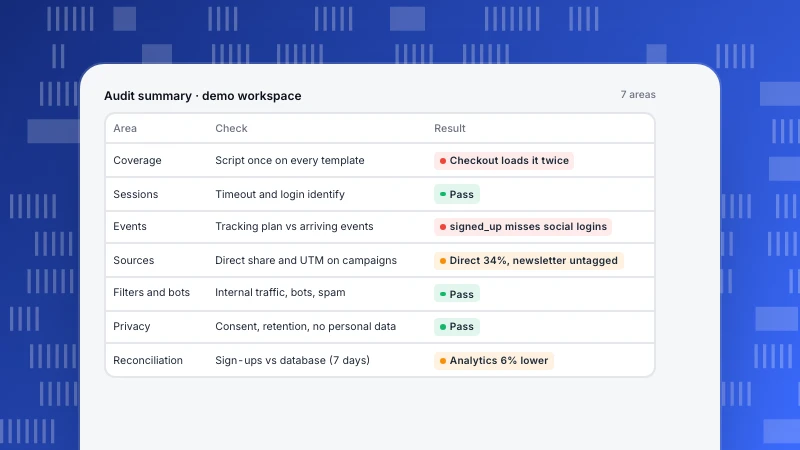
Web Analytics Audit: A Checklist in Seven Areas
A web analytics audit in seven areas: coverage, sessions and identity, events, sources, filters and bots, privacy, and reconciliation with your backend. A concrete check for each, how to run it, and how to keep it healthy afterwards.
Read more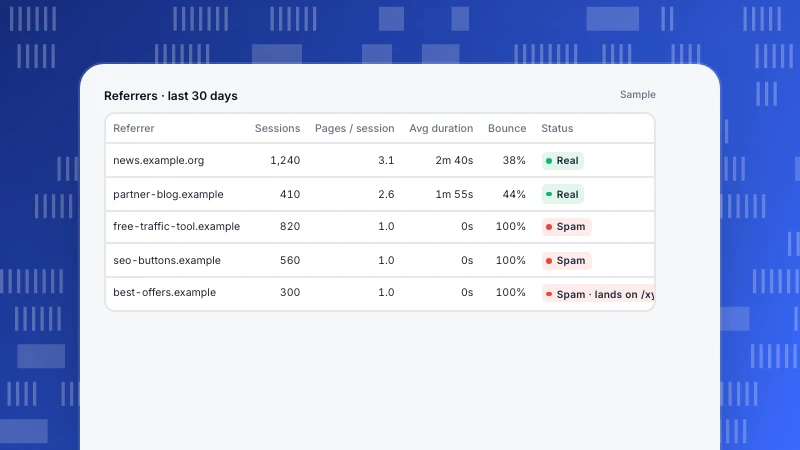
Referral Spam: Three Kinds, How to Spot Each, and Where to Stop It
Referral spam comes in three kinds: ghost hits that never touch your site, crawler visits and scripted browser visits. The report signals for each and the fix that belongs at each layer, from collection allowlists to filters.
Read more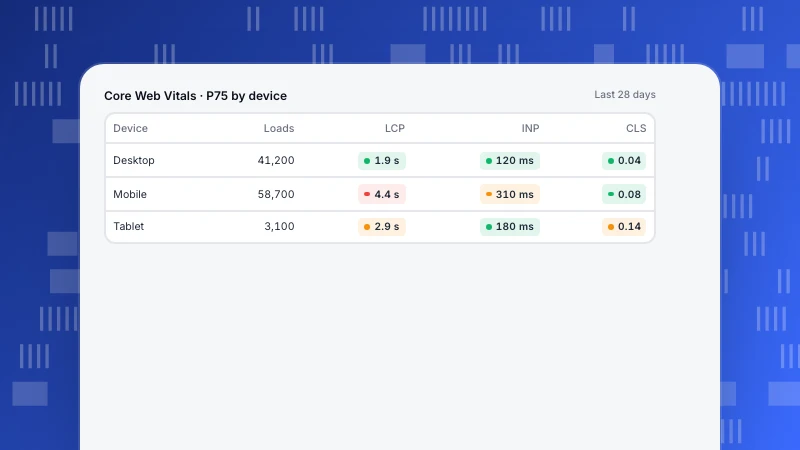
Real User Monitoring: How to Read Speed Data from Real Visits
Real user monitoring (RUM) measures speed in visitors' own browsers. How it differs from synthetic tests, why P75 by device is the default view, how small samples mislead, and how to turn a slow segment into a fix.
Read more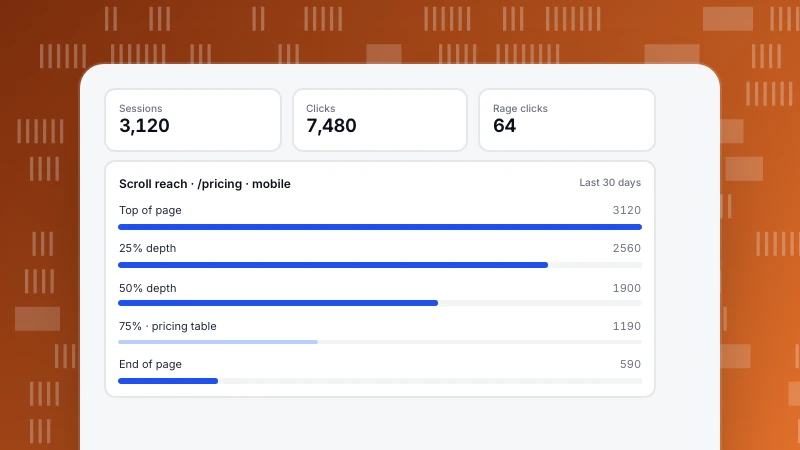
How to Read a Heatmap: Clicks, Rage Clicks and Scroll Reach
How to read a heatmap: colour is relative density, so check the legend and the base first. Then website heatmaps one by one (clicks, rage clicks, scroll reach, elements) and the checks to run before changing a page.
Read more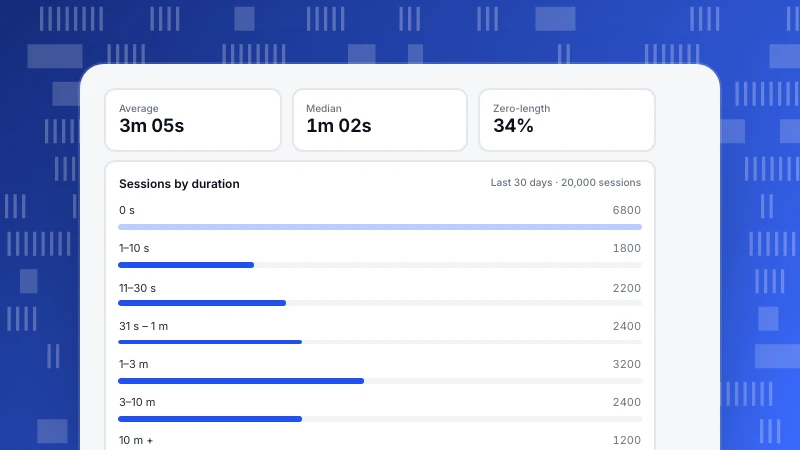
Average Session Duration: How It's Calculated and Why the Mean Misleads
Average session duration is the last event minus the first, averaged over sessions. Why one-page sessions often count as zero, how a few long sessions inflate the mean, and how to read it as a distribution instead.
Read more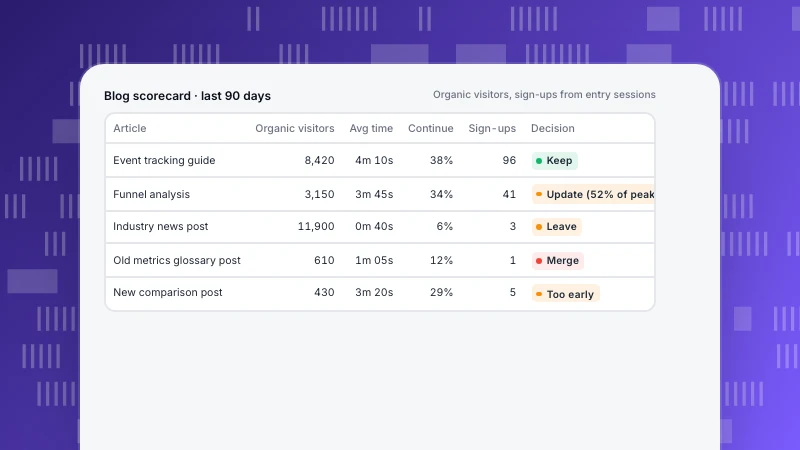
Content Performance Metrics: Score Each Article in Four Stages
Content performance metrics grouped into four stages for each article (found, read, acted, lasted), a scorecard that turns them into keep, update, merge or remove decisions, and a fixed-window check for decay.
Read more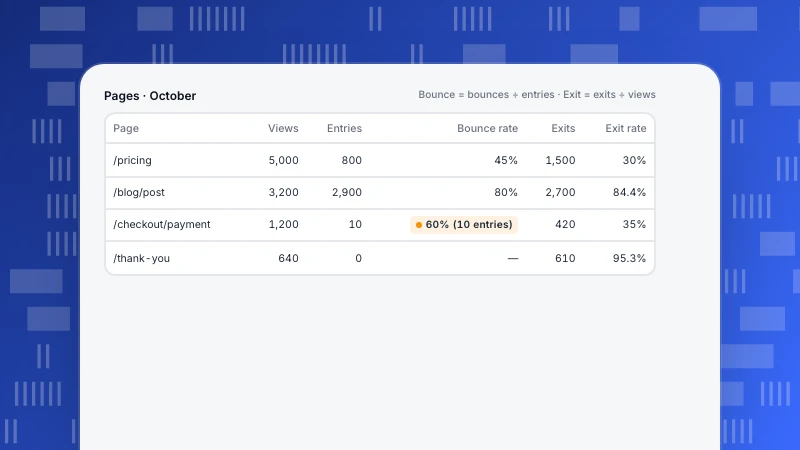
Bounce Rate vs Exit Rate: Different Denominators, Different Questions
Bounce rate divides single-page sessions by sessions that started on a page; exit rate divides exits by every view of that page. A worked table, which pages each one fits, and the mistakes to avoid.
Read moreFive categories, one question each
Each category answers a recurring question we hear from customers. Start with the one closest to your job.
Analytics
Definitions, funnels, retention and the data-quality questions behind every number.
87 articlesGrowth & Marketing
Acquisition, marketing, site and app operations, and how to pick the one stage worth fixing first.
69 articlesLive Chat
Proactive invites, translation and turning support conversations into conversions.
10 articlesAI Search
GPTBot, ClaudeBot, PerplexityBot: who fetches your pages, what the files say and what comes back.
32 articlesProduct News
What shipped, why we built it that way, and how to turn it on.
32 articles