Blog Analytics, growth and chat, explained with real numbers · Page 3
Practical notes from the team building TapCub: how metrics are defined, where funnels break, what AI crawlers take from your site, and how support teams turn conversations into conversions.
Browse every article
Filter by category or search a keyword. Every article links to the report or setting it talks about.
230 articles · page 3 of 5
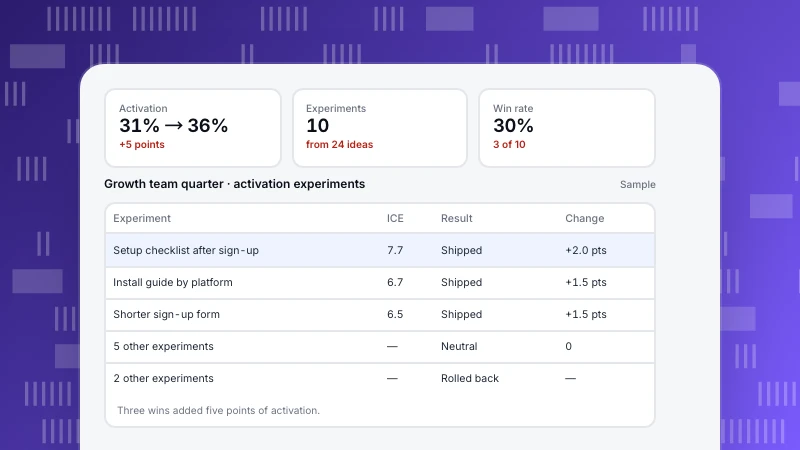
Growth Team: What It Does, How to Structure It, and a Real Quarter
A growth team is a small cross-functional group that owns one growth metric and improves it through fast experiments. Three ways to structure it, the roles, the weekly loop, and a worked quarter where 10 experiments moved activation from 31% to 36%.
Read more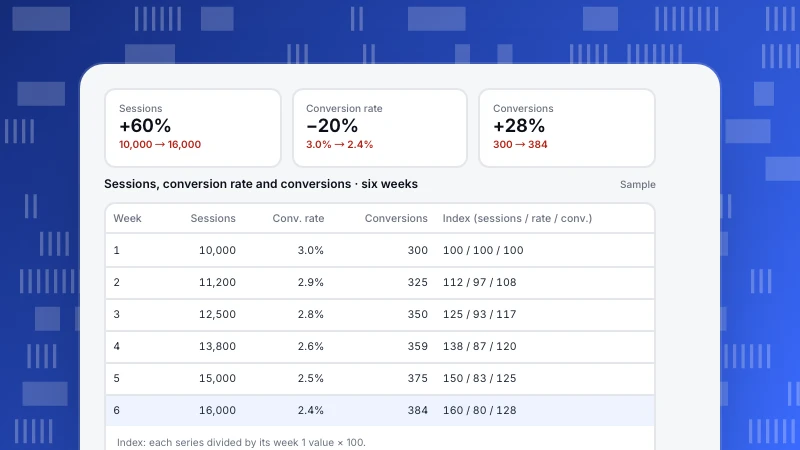
Dual Axis Charts: When They Mislead and What to Use Instead
A dual-axis chart puts two measures with different units on one chart, each with its own y-axis. The axis ranges are arbitrary, so the chart can show crossings and correlations that mean nothing. When it is acceptable, and four clearer alternatives with the same data.
Read more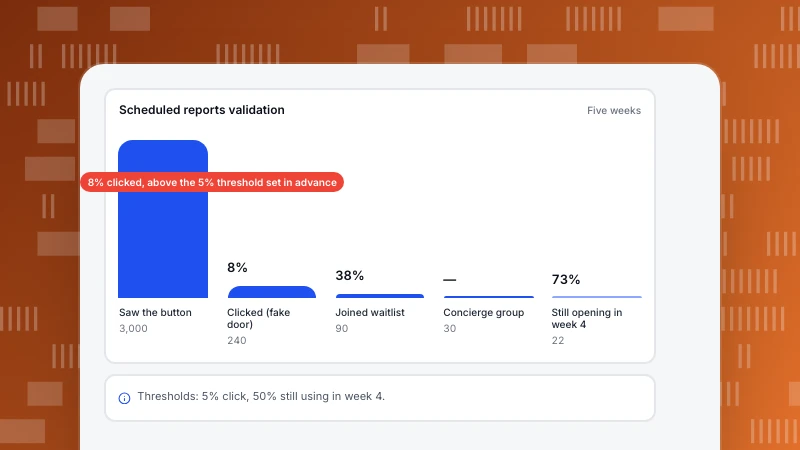
Product Validation: Test Demand Before You Build
Product validation checks that a problem is real, that people want your solution, and that they keep using it, before you spend months building. Four things to validate, methods by cost, and a worked fake-door and concierge test with thresholds set in advance.
Read more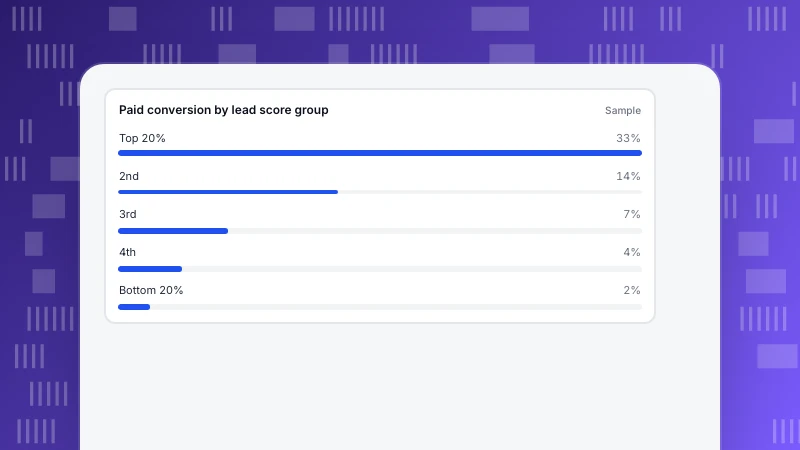
Predictive Analytics in Marketing: Use Cases and a Simple First Model
Predictive analytics in marketing uses past behavior to estimate what a person or a segment will do next: buy, upgrade, churn or respond. Five use cases, a simple lead score checked on held-out data, and how to judge whether a model really works.
Read more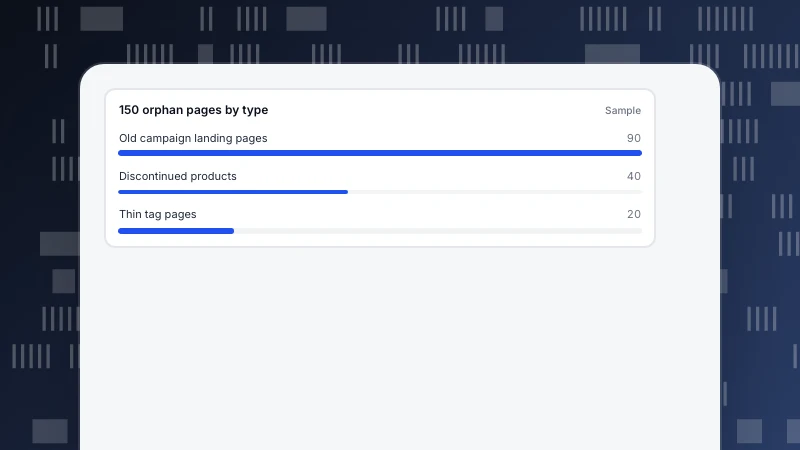
Orphan Pages: How to Find and Fix Them
Orphan pages exist on your site but no other page links to them, so visitors and search engines struggle to find them. How to find them by comparing URL lists, a worked example of 150 orphans, and when to link, redirect or remove.
Read more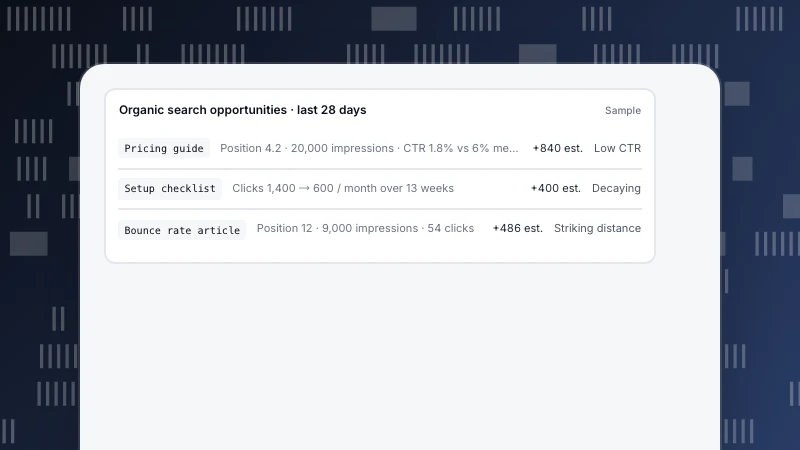
How to Improve Organic Search: Start With What You Already Rank For
The fastest organic search gains usually come from pages that already rank: fix titles with low CTR, push pages from positions 8–20 into the top 5, refresh decaying content, and remove technical blockers. A worked example with click estimates.
Read more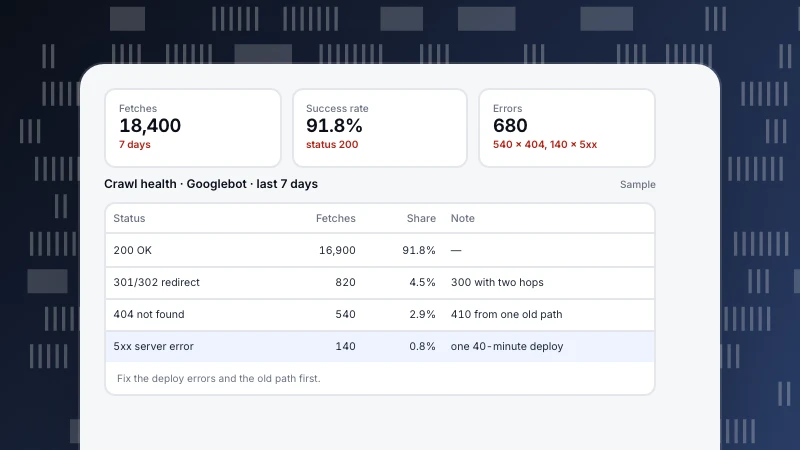
Crawl Errors: Types, Causes and How to Fix Them
Crawl errors are failed requests from search engine bots: DNS and server errors, timeouts, 404s and redirect problems. The main types, what causes them, a worked week of Googlebot data, and the order to fix them in.
Read more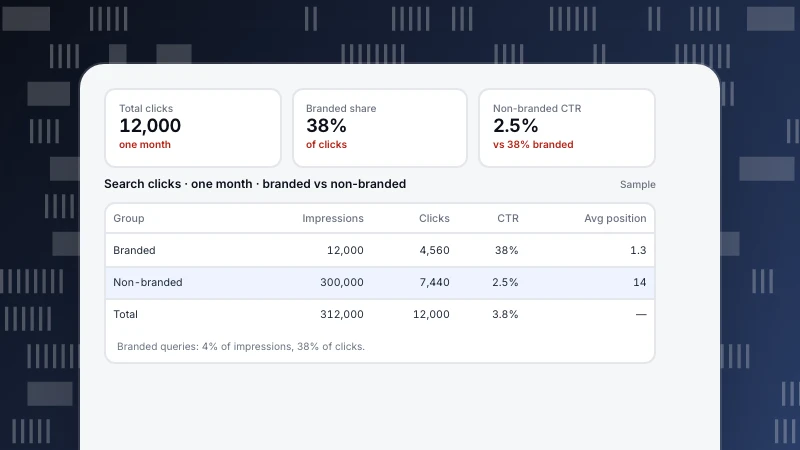
Branded vs Non-Branded Keywords: What to Track and Report
Branded keywords include your brand name; non-branded keywords describe the problem. They behave very differently in search. How to split them in your own data, a worked example, and which one shows real SEO growth.
Read more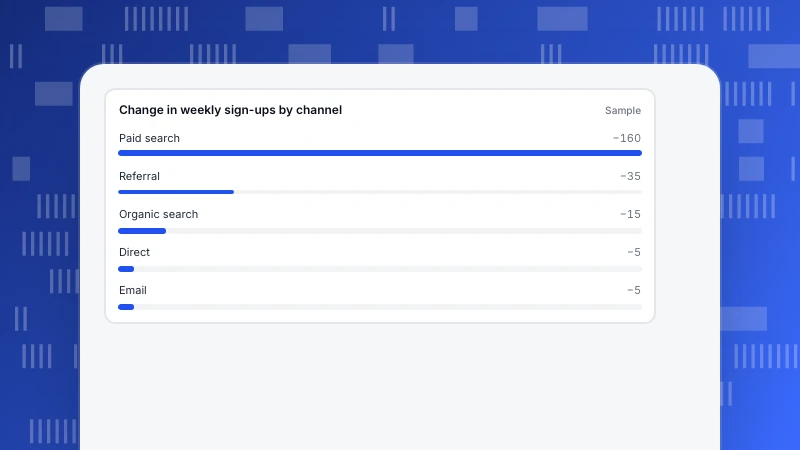
How to Analyze Data: 6 Steps and a Worked Example
A practical six-step way to analyze data: start from a question, pick the metric, check the data, break the change down, test the explanation and act. With a worked example of a 220 sign-up drop traced to one channel.
Read more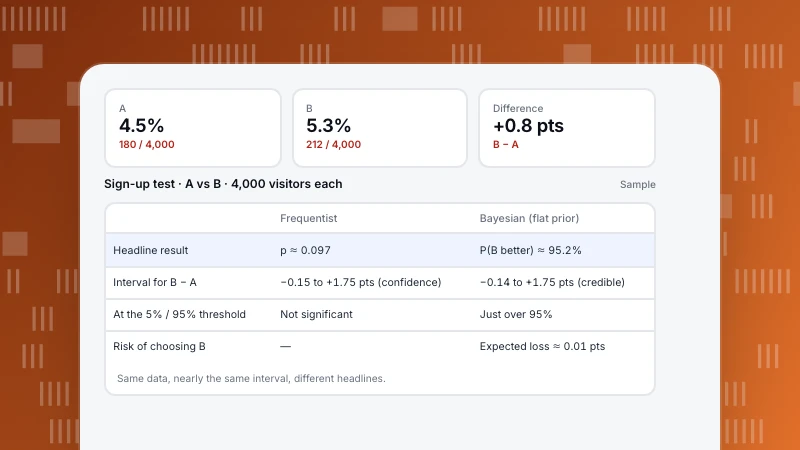
Bayesian vs Frequentist: The Same A/B Test, Analysed Both Ways
Frequentist and Bayesian statistics answer different questions about the same data. A plain explanation of both, one A/B test analysed each way (p = 0.097 vs a 95% chance B is better), and when to use which.
Read more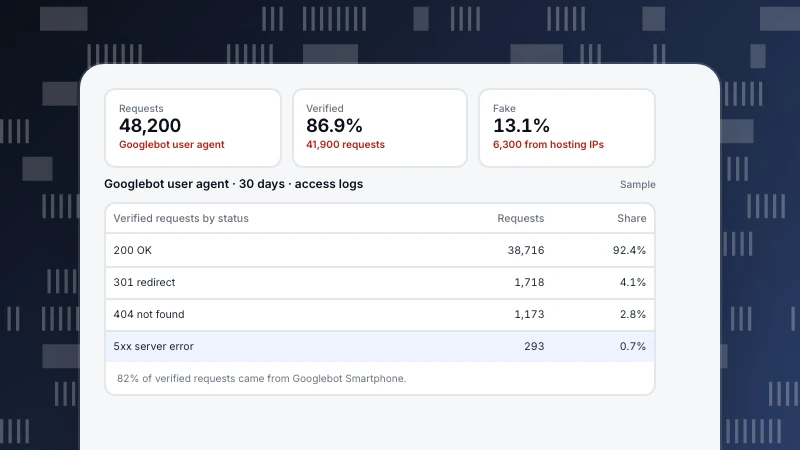
Googlebot: What It Is, How It Crawls and How to Verify It
Googlebot is the crawler Google uses to fetch pages for Search. How it crawls and renders, the other Google crawlers you will see in logs, how to tell a real Googlebot from a fake one, and a sample month of log data.
Read more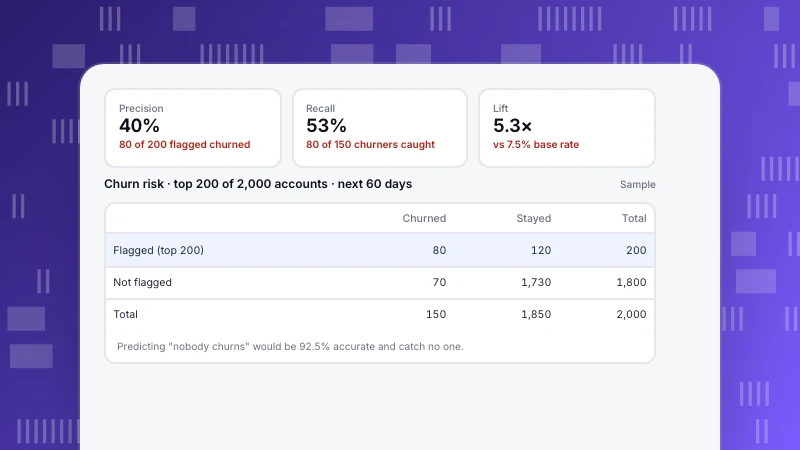
Customer Churn Prediction: Signals, Simple Models and How to Judge Them
Churn prediction flags customers likely to cancel early enough to do something about it. Which signals predict churn, a rule-based way to start, and a worked example of judging a model by precision, recall and lift.
Read more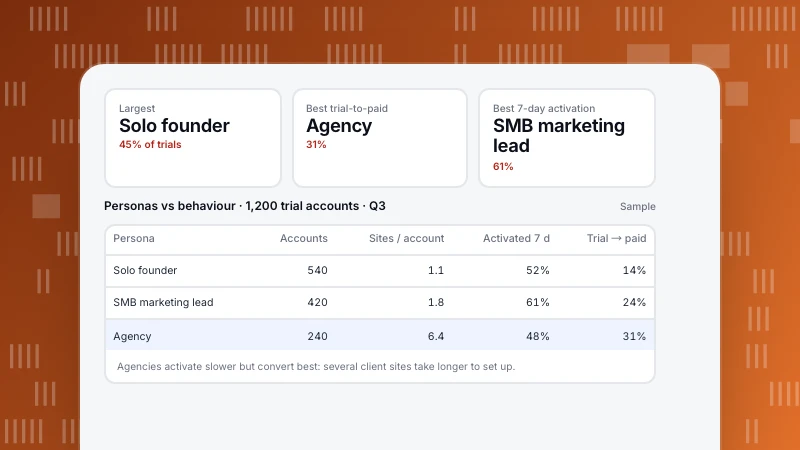
User Personas: How to Build Them From Real Data
A user persona is a short profile of a type of user, built from research. What to include, how personas differ from segments, how to check them against usage data, and a sample of three personas with real behaviour behind them.
Read more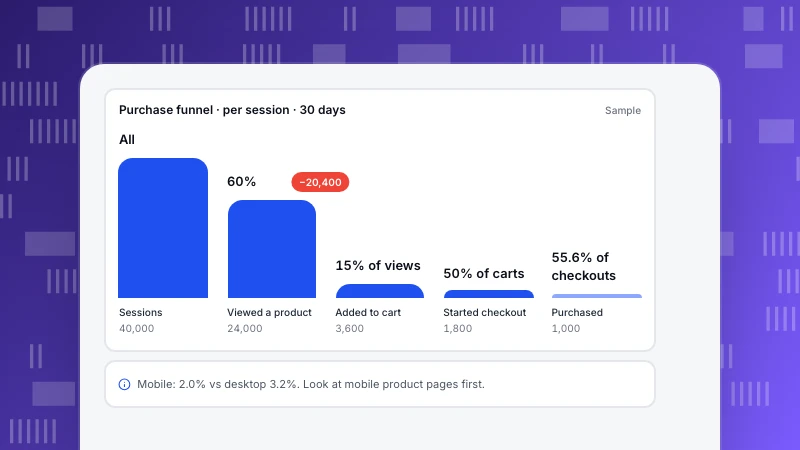
Ecommerce Conversion Rate: How to Calculate, Compare and Improve It
Ecommerce conversion rate is the share of sessions or visitors that end in a purchase. How to calculate it, why benchmarks disagree, a sample store split by device and funnel step, and which lever fits each step.
Read more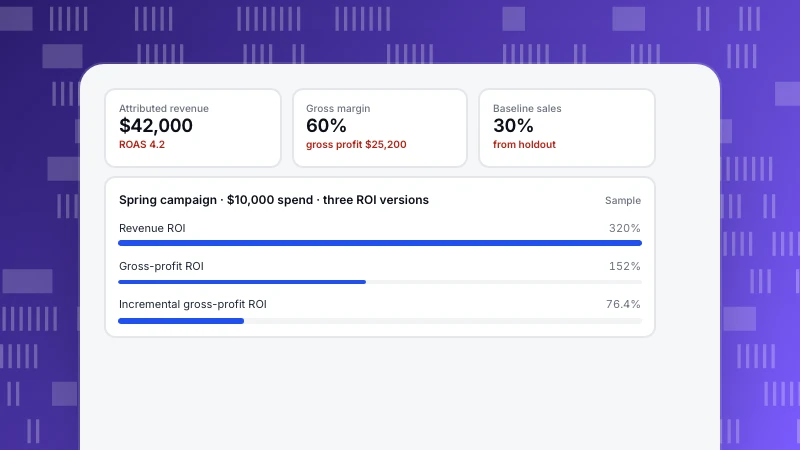
Marketing ROI: How to Calculate It (and Why the Simple Formula Misleads)
Marketing ROI compares what a campaign earned with what it cost. The formula in three versions, a worked example where the same campaign shows 320%, 152% or 76% depending on the method, and how ROI differs from ROAS.
Read more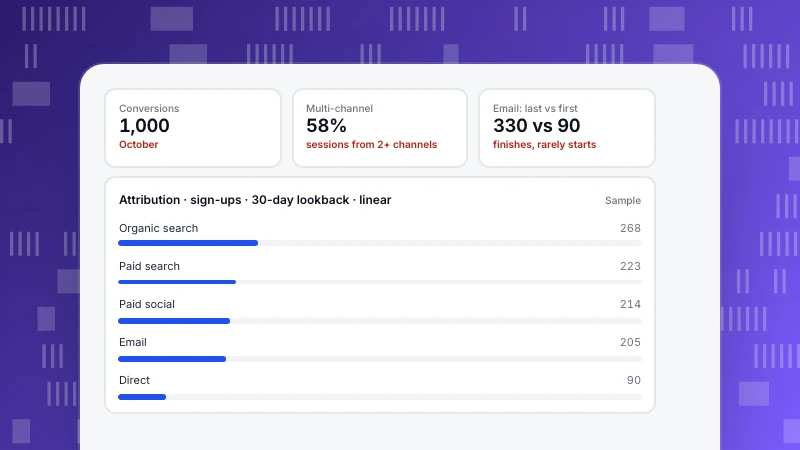
Cross-Channel Marketing: How to Plan It and Measure What Works
Cross-channel marketing connects channels into one journey instead of running them side by side. How it differs from multichannel and omnichannel, a sample of 1,000 conversions credited three ways, and the measurement rules that keep it honest.
Read more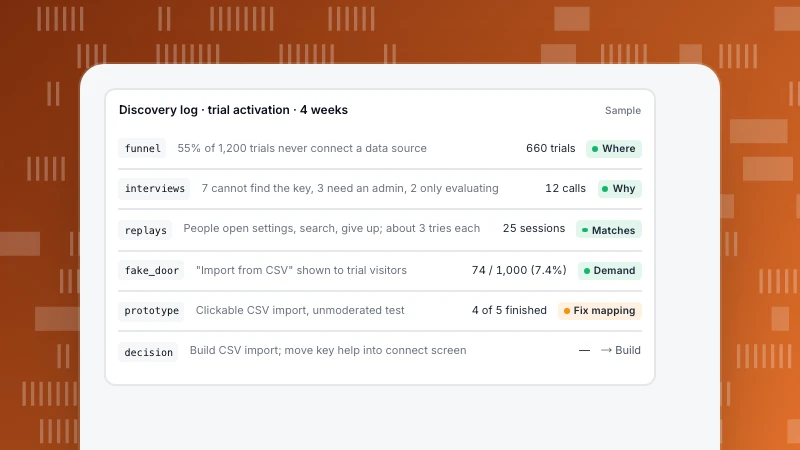
Product Discovery: How to Decide What to Build, With Evidence
Product discovery is the work of finding out what is worth building before you build it. The four risks to test, the methods for each, a worked case from usage data to a decision, and a weekly cadence that keeps it going.
Read more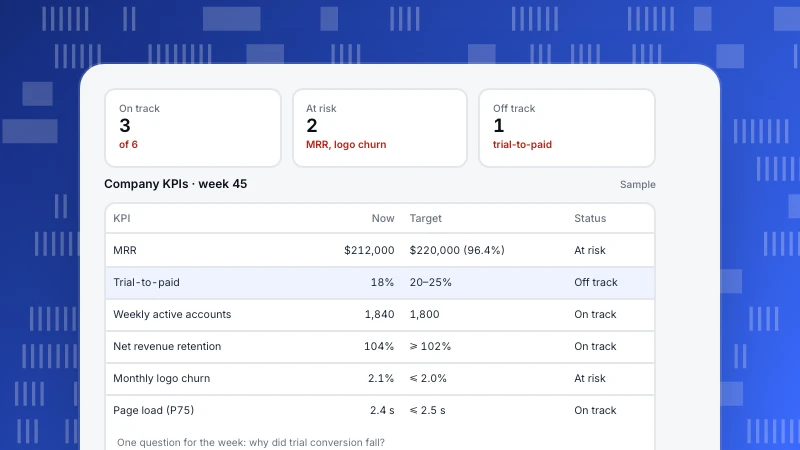
KPI Dashboard: How to Design One People Actually Use
A KPI dashboard shows a handful of key numbers, each with a target and a status, so anyone can see in a minute what is on track. Eight design rules, a sample company dashboard, and how to build one in six steps.
Read more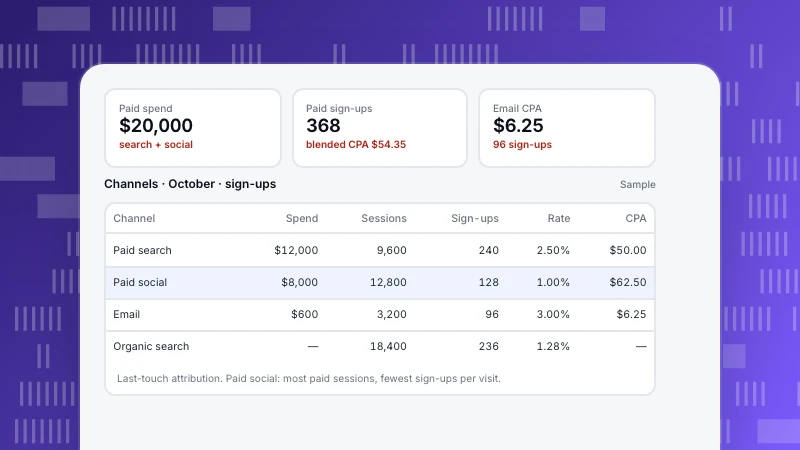
Marketing Dashboard: What to Include, With a Sample Layout
A marketing dashboard shows which channels bring customers and at what cost. The five sections to include, a sample channel table with spend, conversions and CPA, blended vs channel numbers, and the mistakes that make dashboards misleading.
Read more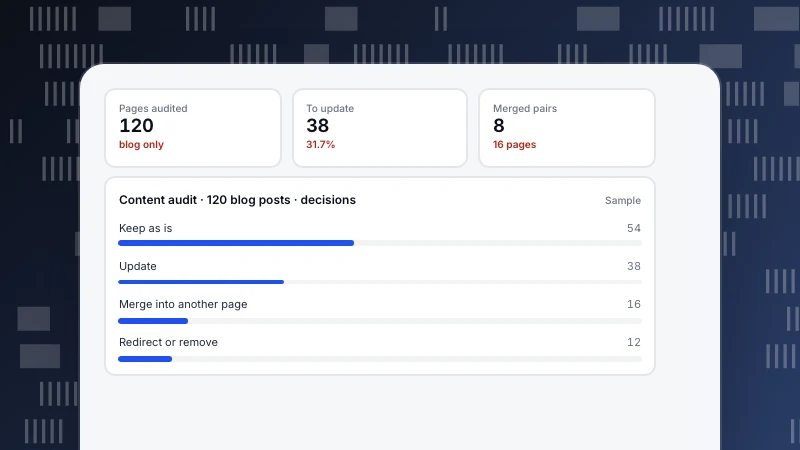
Content Audit: How to Review Every Page and Decide What to Do
A content audit lists every page with its traffic, conversions, links and trend, then decides to keep, update, merge or remove it. The data to collect, decision rules, and a worked sample of 120 pages.
Read more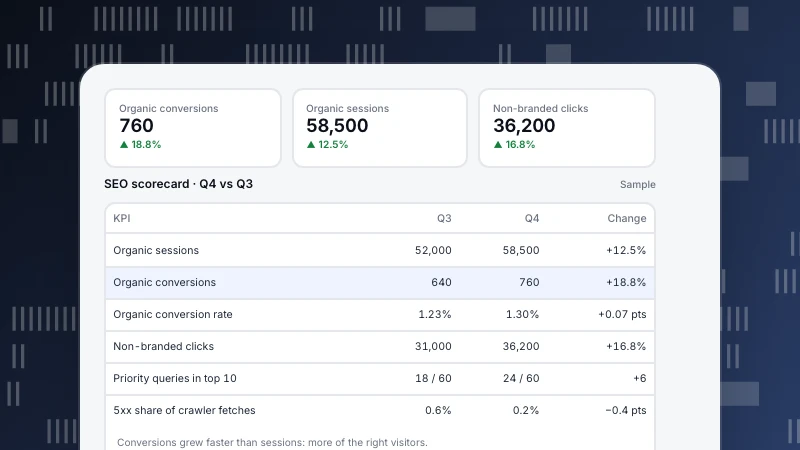
SEO KPIs: 10 Metrics That Show Whether SEO Is Working
Not every SEO metric is a KPI. Ten SEO KPIs in three tiers, business, visibility and technical health, with formulas, data sources, a sample quarterly scorecard and how to set targets.
Read more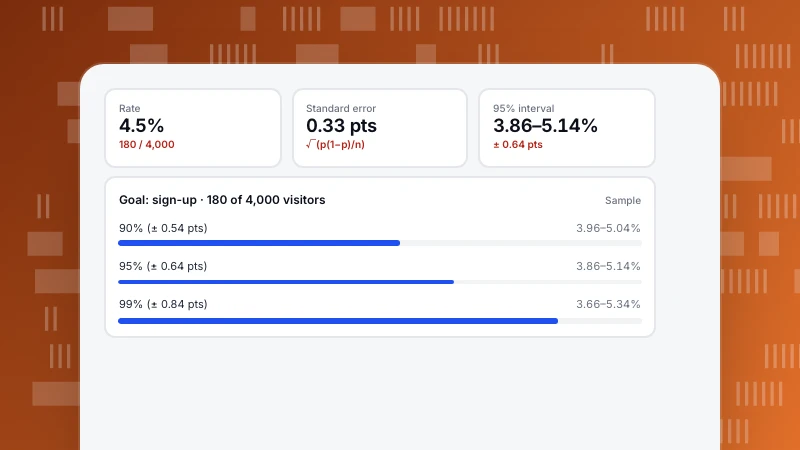
How to Calculate a Confidence Interval (With Conversion Rate Examples)
A confidence interval gives the range a true value probably sits in. The formulas for a mean, a rate and a difference between two rates, worked examples with conversion data, and what to do with small samples.
Read more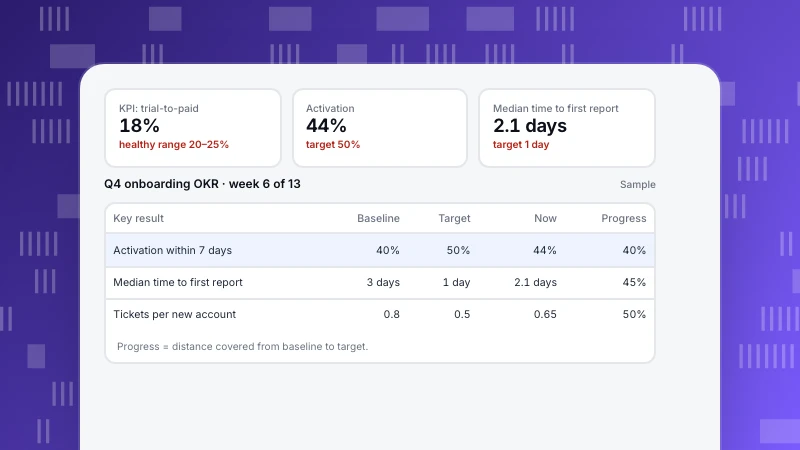
OKR vs KPI: The Difference and How to Use Them Together
KPIs track the health of what you already do; OKRs describe the change you want this quarter. The difference, how one feeds the other, a worked example with measurable key results, and the common mistakes.
Read more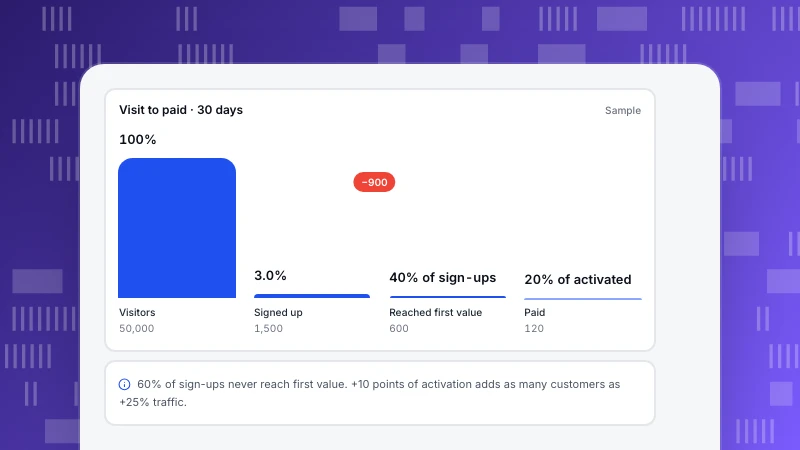
Growth Marketing: What It Is and How to Run It With Data
Growth marketing works on the whole customer journey, not just the top of the funnel, and runs on small, measured experiments. How it differs from traditional marketing, a sample funnel and experiment backlog, and the metrics for each stage.
Read more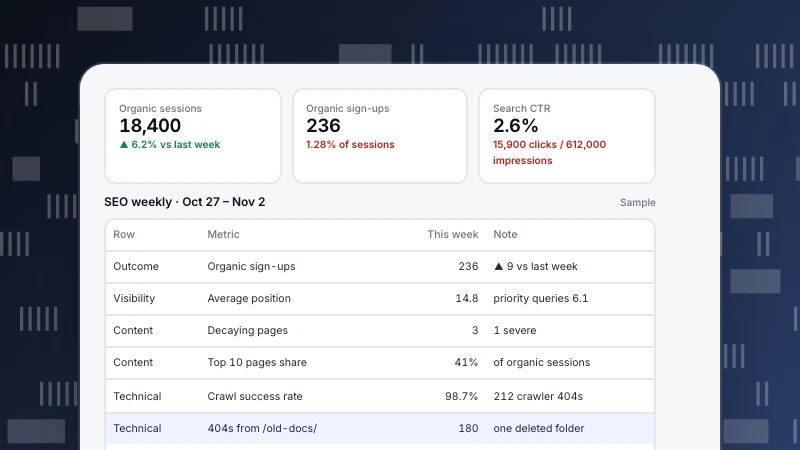
SEO Dashboard: What to Include and How to Read It
An SEO dashboard should answer three questions: is organic search bringing business, are we more visible, and is anything broken. A four-row layout, a sample weekly dashboard with numbers, and what to leave out.
Read more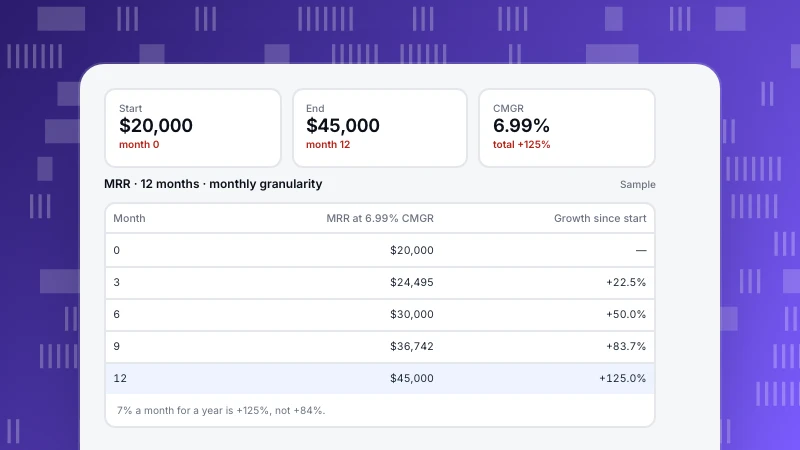
Compound Monthly Growth Rate (CMGR): Formula and Examples
Compound monthly growth rate (CMGR) is the steady monthly rate that takes you from a starting value to an ending value. The formula, a 12-month MRR example, why averaging monthly growth rates overstates growth, and how to calculate it in a spreadsheet.
Read more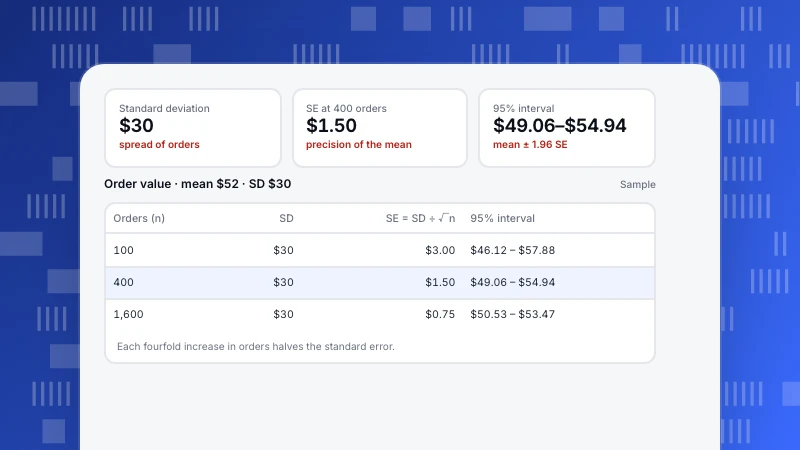
Standard Deviation vs Standard Error: The Difference, With Examples
Standard deviation describes how spread out your data is; standard error describes how precise your average is. The formulas, a worked example at three sample sizes, the conversion-rate version and the mistakes to avoid.
Read more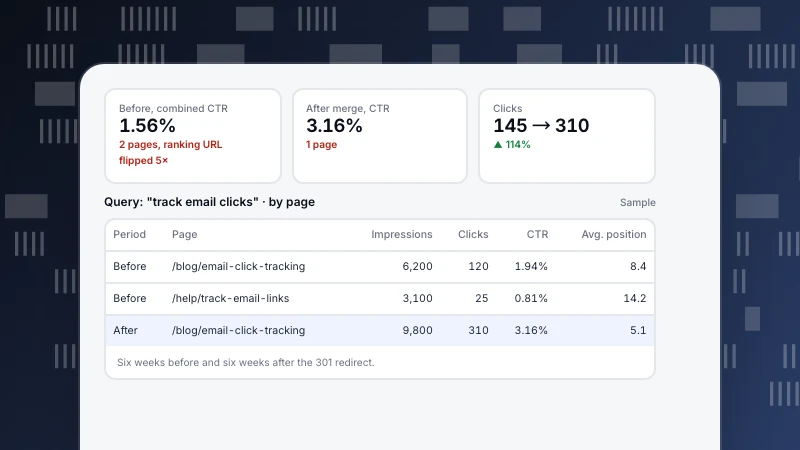
Keyword Cannibalization: How to Find It, Prove It and Fix It
Keyword cannibalization is when two of your pages compete for the same query and both rank worse than one would. How to tell real cannibalization from harmless overlap, a worked example with split clicks, and which fix to use.
Read more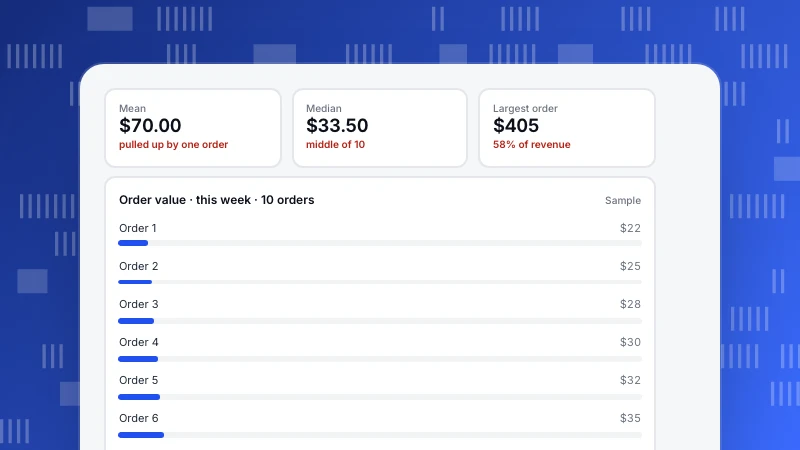
Mean vs Median: Which Average to Use for Your Metrics
The mean adds everything up and divides; the median is the middle value. A worked example where one large order doubles average order value, when to use each, and which analytics metrics should be read as medians.
Read more
Data Storytelling: A Five-Part Structure, With a Before and After
Data storytelling turns an analysis into a decision someone can act on. A five-part structure for reports and presentations, the same analysis told badly and well, chart-choice rules and how to keep the story honest.
Read more
Product-Market Fit Metrics: Six Signals and How to Read Them
How to measure product-market fit with six signals: a retention curve that flattens, repeat use, organic growth, the "very disappointed" survey, willingness to pay and referral. How to read them together, with a sample.
Read more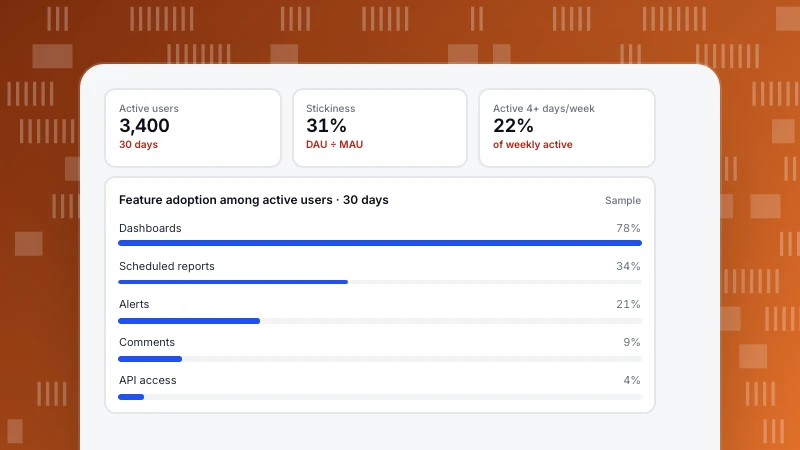
Product Usage Analytics: The Five Metrics and How to Use Them
Product usage analytics measures how people use your product: which features, how often and how deeply. Five usage metrics with formulas, user vs account views and a sample feature table that led to a decision.
Read more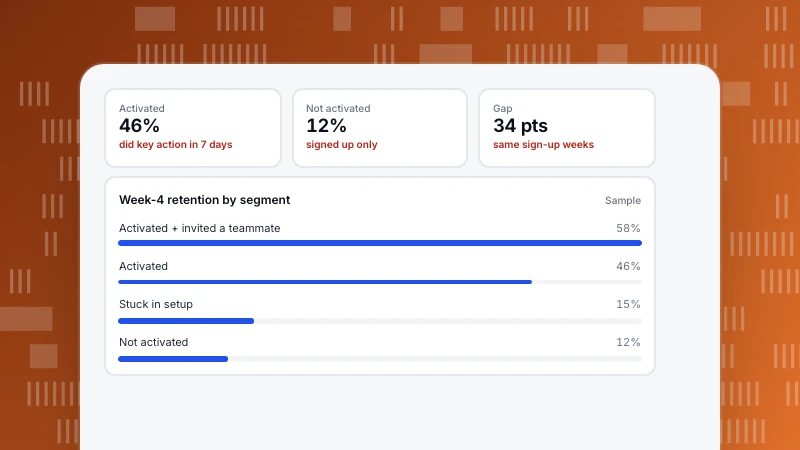
User Segmentation Examples: 12 Segments You Can Build From Event Data
Twelve user segmentation examples a product or growth team can build from event data, each with the rule and what to do with it. Plus a sample comparing two segments and how to keep segments useful.
Read more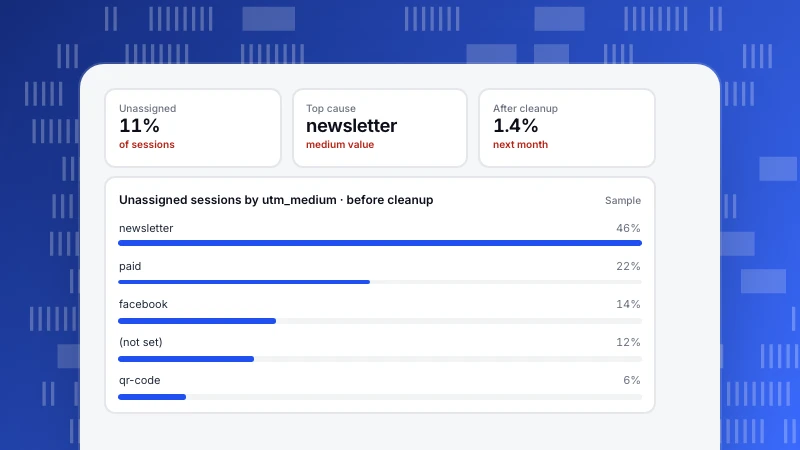
Unassigned Traffic in GA4: What It Means and How to Fix It
Unassigned is the GA4 channel for sessions that match no channel rule. The usual causes, how to find which applies, a table of medium values to rename, a sample cleanup and a naming standard to prevent it.
Read more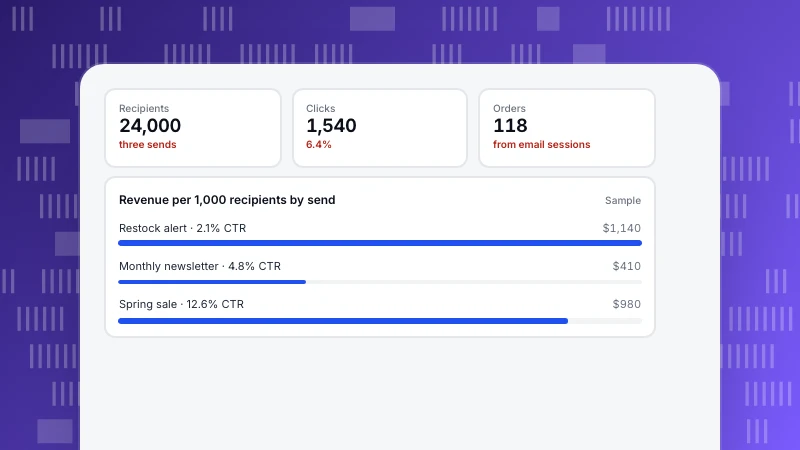
How to Track Email Marketing Campaigns Beyond Opens and Clicks
How to track email campaigns end to end: what your email tool measures, what analytics measures after the click, a UTM scheme for every link, a sample comparing three sends by outcome and the usual ways tracking breaks.
Read more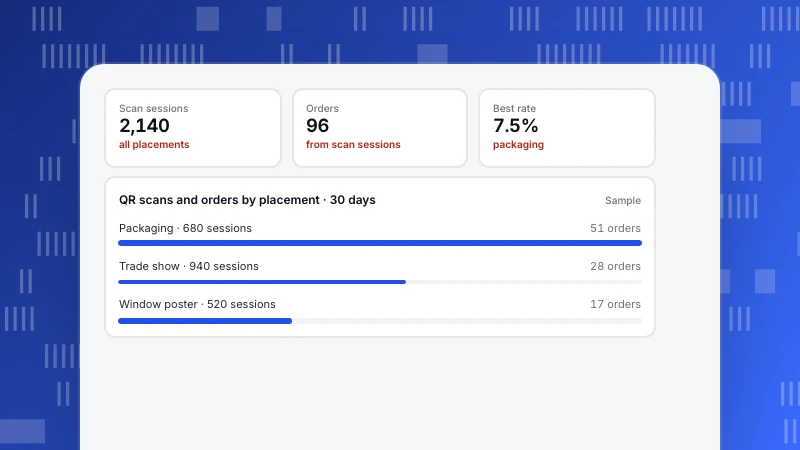
How to Track QR Code Scans, From Scan to Sale
How to track QR code scans end to end: tag the link with UTM parameters per placement, read scans as sessions in analytics, and follow them through to sign-ups and sales. With a sample of three placements.
Read more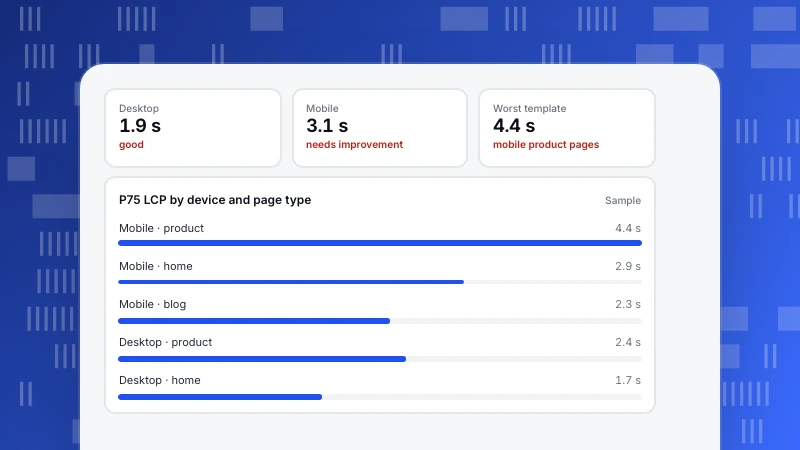
What Is a Good Page Load Time? A Clear Target and How to Check It
A good page load time is when the main content appears within 2.5 seconds for three in four real visits. Why full load time misleads, targets for each timing, and a sample split by device and page type.
Read more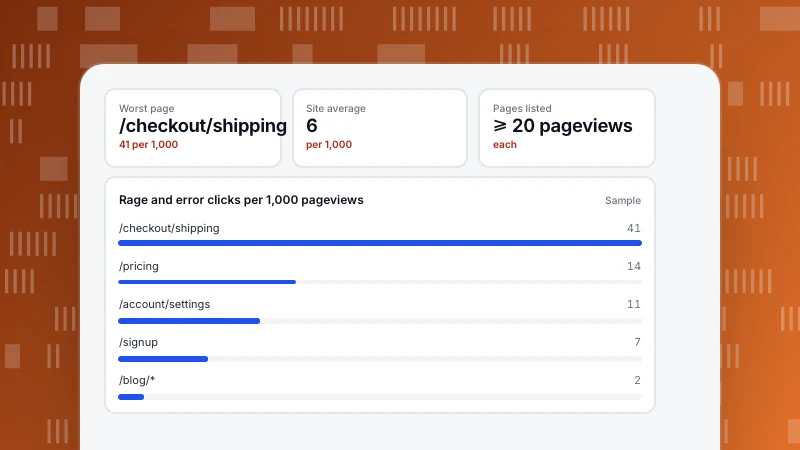
User Friction: How to Find It in Your Data and Fix It
User friction is anything that slows people down or stops them reaching their goal. The signals that reveal it in behaviour data, a sample where rage clicks pointed to the fix, and a routine for ranking friction points.
Read more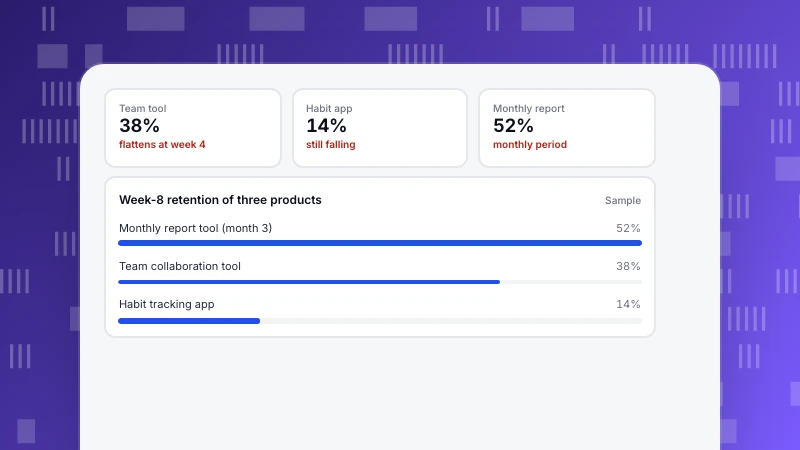
What Is a Good Retention Rate? Read the Curve, Not One Number
A good retention rate depends on the product, the definition and the time frame. Why benchmarks disagree, what the shape of the retention curve tells you, a sample of three products and how to set your own target.
Read more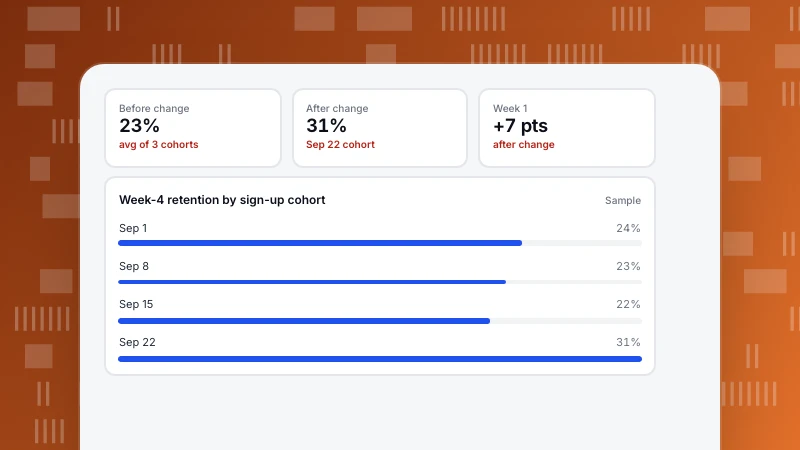
How to Do Cohort Analysis: Six Steps and How to Read the Table
A step-by-step guide to cohort analysis: choose the start and return events, the period and the counting mode, then read the table by rows, columns and diagonals. With a sample weekly cohort table.
Read more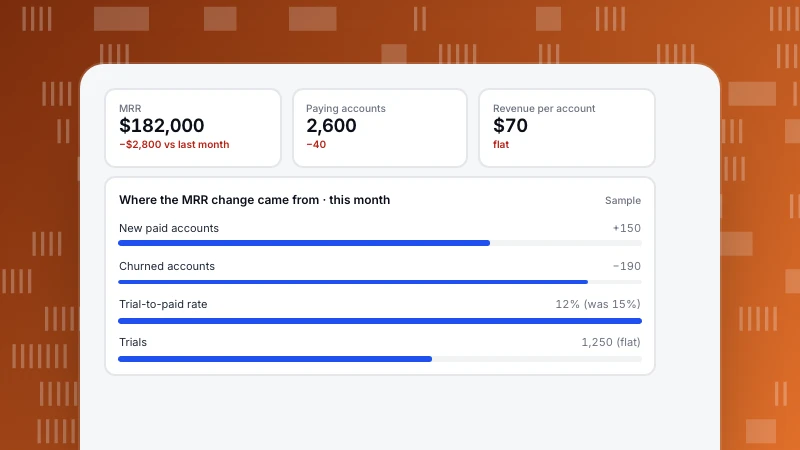
Metric Tree: How to Build One and Use It to Explain Changes
A metric tree breaks one top metric into the drivers that produce it. How to build one in five steps, a sample tree with numbers, how to use it to explain a drop, and how to keep it in your analytics.
Read more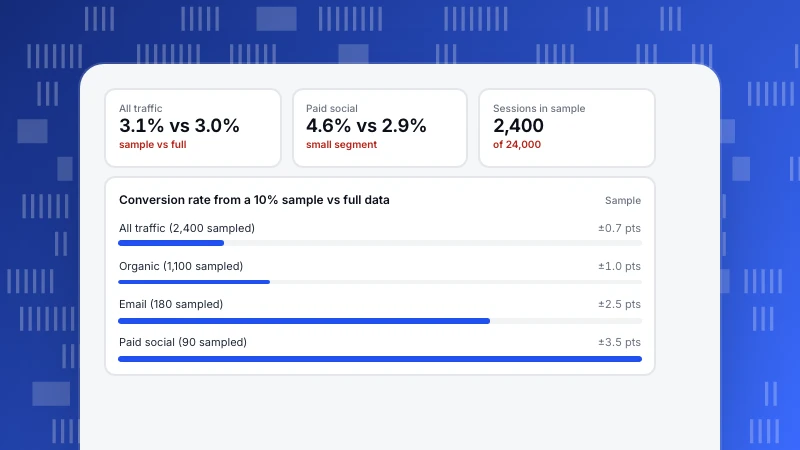
Data Sampling in Analytics: When It Is Fine and When It Misleads
Data sampling means reading a subset to estimate the whole. The main sampling methods, where analytics tools sample, how small segments and rare events go wrong, and rules for trusting sampled numbers.
Read more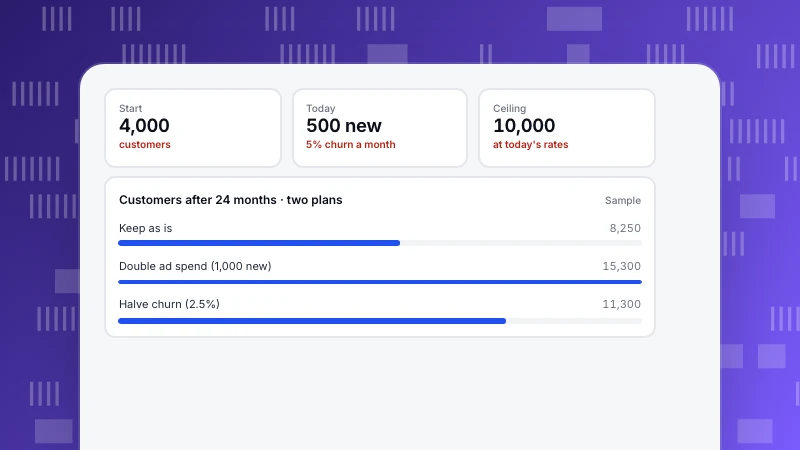
The Leaky Bucket in Marketing: Why Growth Stalls and How to Fix It
The leaky bucket is the idea that pouring in new customers is wasted while existing ones leak out. The simple math behind it, a sample comparing more acquisition with lower churn, and how to find the leaks.
Read more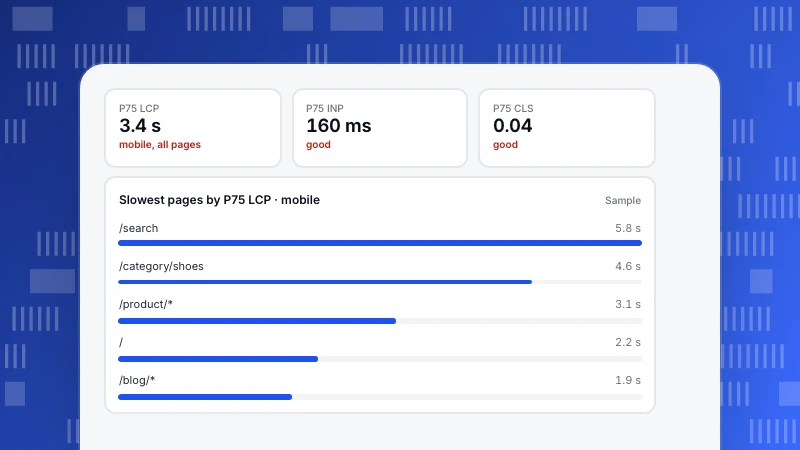
Website Performance Metrics: The Five to Watch and How to Read Them
The website performance metrics that matter: LCP, INP, CLS, FCP and TTFB, their thresholds, why to read the 75th percentile from real users, and a sample that traces a slow page to its cause.
Read more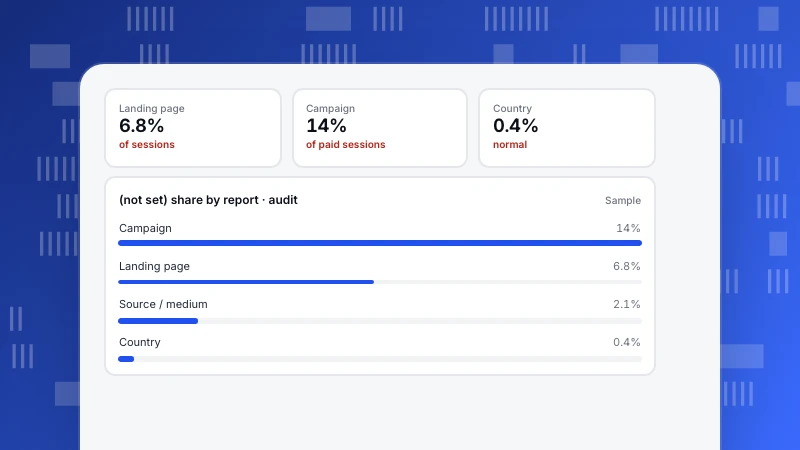
What Is (not set) in Google Analytics? Causes and Fixes by Report
(not set) is the placeholder Google Analytics shows when a value is missing for a dimension. Where it appears, the usual cause in each report, how much is normal and how to reduce it.
Read more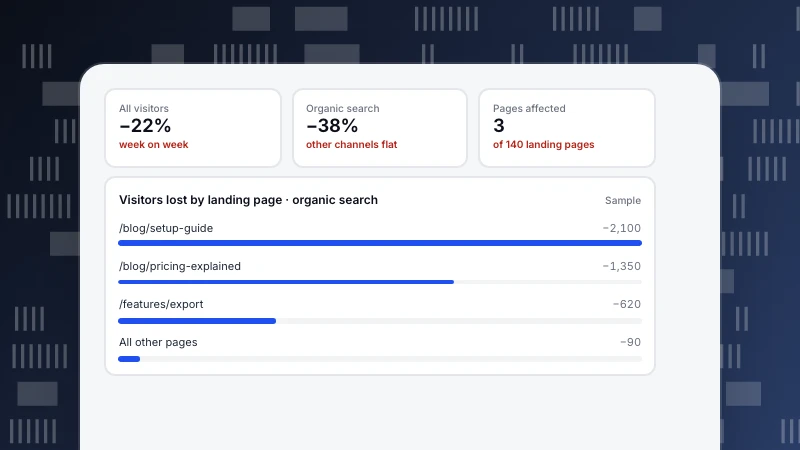
Sudden Drop in Website Traffic? A 15-Minute Triage
When website traffic drops suddenly, first check whether the drop is real, then find which channel, pages and devices it sits in. A step-by-step triage, a table of causes with their evidence, and a worked example.
Read more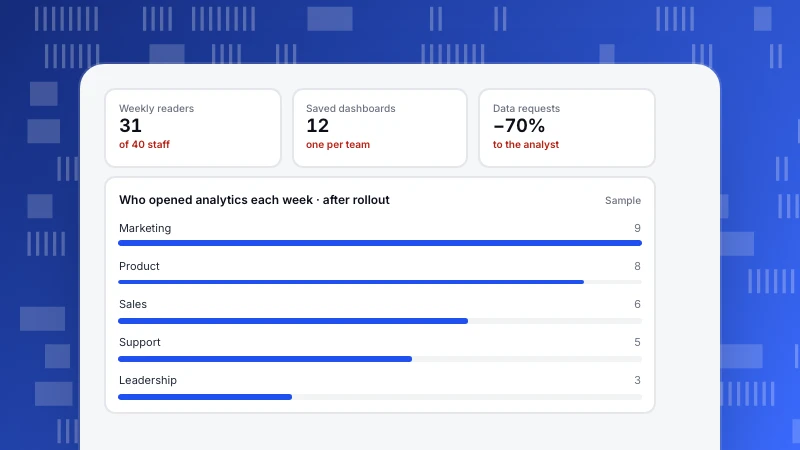
Data Democratization: Give Everyone Data Without Losing Trust
Data democratization means anyone who needs data can get it and read it the same way. What it is, five practical steps from shared definitions to read-only links, a sample role setup, and the risks to manage.
Read more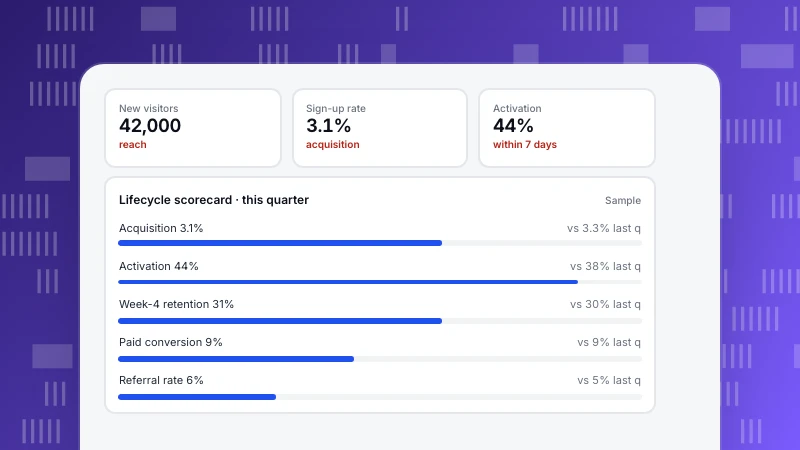
Customer Lifecycle Metrics: One Number per Stage, and How to Read Them
Customer lifecycle metrics measure how people move from first visit to loyal customer. One metric per stage with its formula, a sample scorecard, and how lifecycle states show movement between stages.
Read moreFive categories, one question each
Each category answers a recurring question we hear from customers. Start with the one closest to your job.
Analytics
Definitions, funnels, retention and the data-quality questions behind every number.
87 articlesGrowth & Marketing
Acquisition, marketing, site and app operations, and how to pick the one stage worth fixing first.
69 articlesLive Chat
Proactive invites, translation and turning support conversations into conversions.
10 articlesAI Search
GPTBot, ClaudeBot, PerplexityBot: who fetches your pages, what the files say and what comes back.
32 articlesProduct News
What shipped, why we built it that way, and how to turn it on.
32 articles