Blog Analytics, growth and chat, explained with real numbers · Page 6
Practical notes from the team building TapCub: how metrics are defined, where funnels break, what AI crawlers take from your site, and how support teams turn conversations into conversions.
Browse every article
Filter by category or search a keyword. Every article links to the report or setting it talks about.
723 articles · page 6 of 16
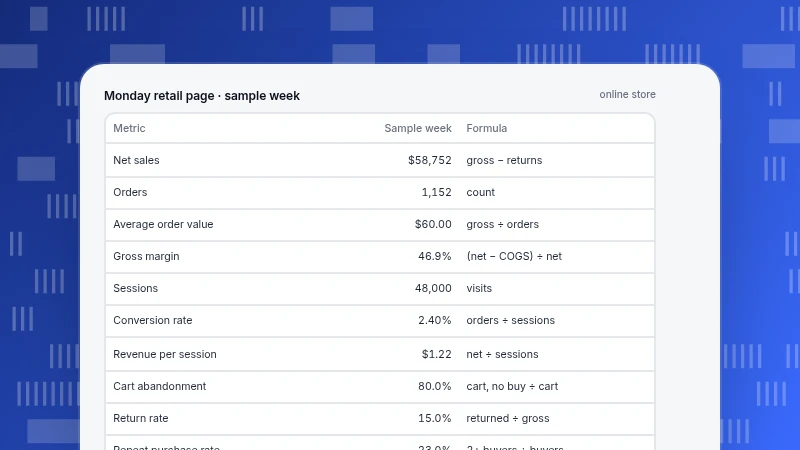
Retail Analytics Dashboard: A 10-Metric Layout With Formulas
A retail analytics dashboard layout in three bands with ten metrics, their formulas and one recomputed sample week, plus a way to decompose a bad week into sessions, conversion and order value.
Read more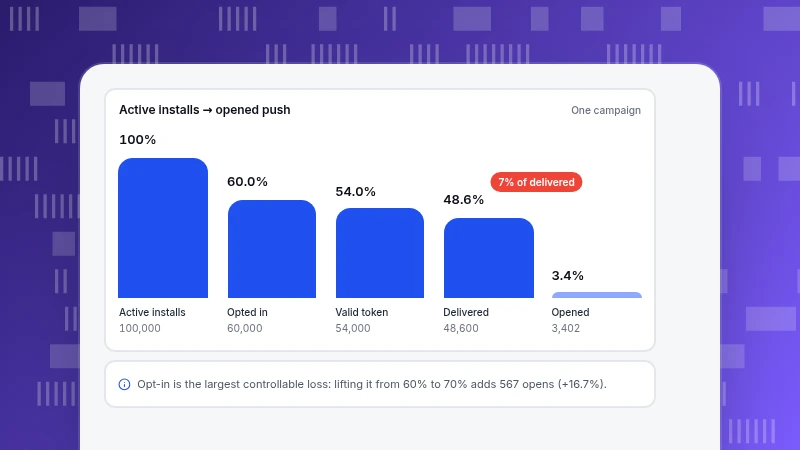
Push Notifications: What They Are and How to Measure Whether They Work
What push notifications are, how a message gets from server to screen, platform opt-in rules, and a recomputed opt-in-to-open funnel with a holdout example that shows what a push actually added.
Read more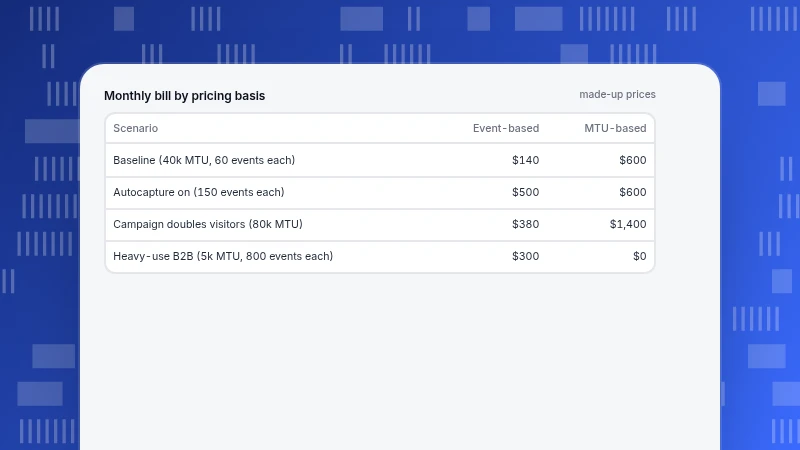
Product Analytics Tools: What to Compare Before You Pick One
How to compare product analytics tools: a five-row matrix (identity, retention, funnels, session replay, pricing basis), a trial test for each row, a worked funnel-counting example and a recomputed events-versus-users pricing table.
Read more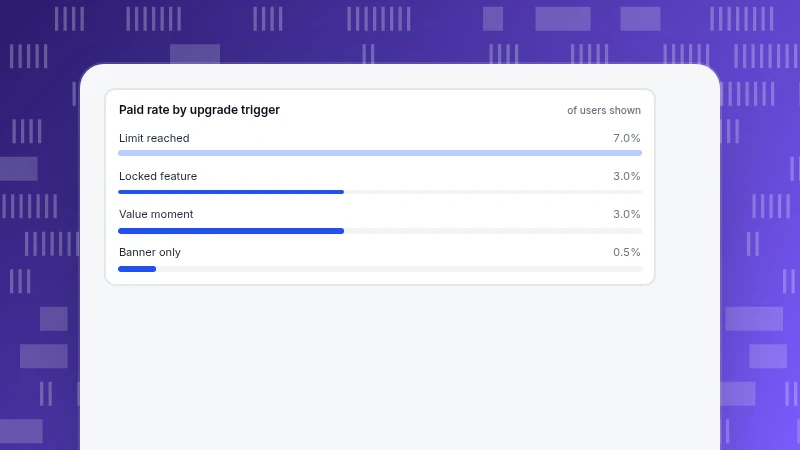
Premium Upsell: Triggers, Timing and What to Measure for SaaS
How to run a premium upsell in SaaS: six triggers with the event and metric for each, a recomputed 10,000-user conversion table, a holdout calculation of true lift and guardrails against cancellations.
Read more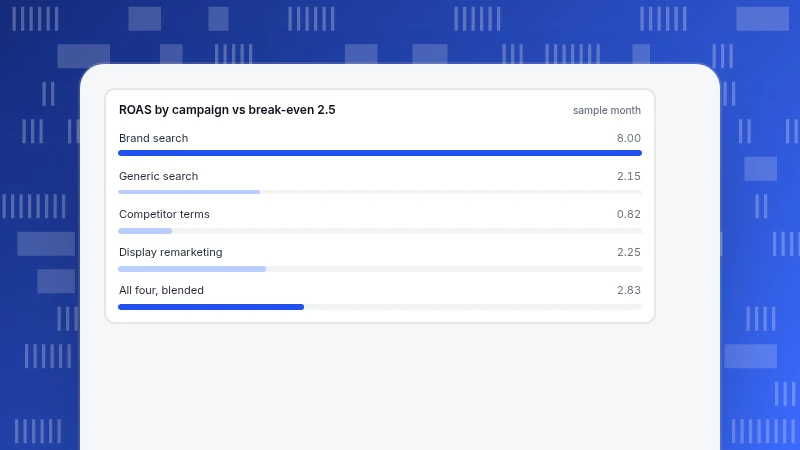
PPC Dashboard: The Metrics, Formulas and Layout That Drive Decisions
What a PPC dashboard should show, with Google Ads definitions for CPC, conversion rate and ROAS, a four-campaign worked example, break-even ROAS rules and a layout you can copy.
Read more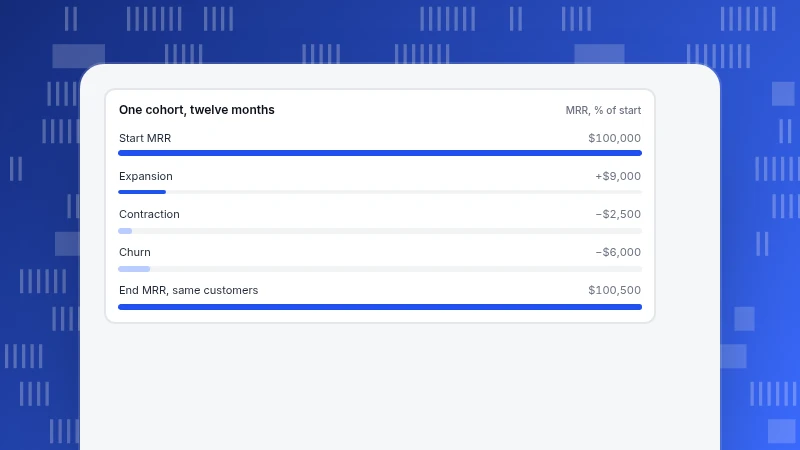
NRR vs GRR: net and gross revenue retention on one worked cohort
NRR counts expansion, GRR does not. One 40-customer cohort recomputed under both formulas shows how a 100.5% NRR can hide a 91.5% GRR, why one account can swing it, and why monthly figures must be compounded.
Read more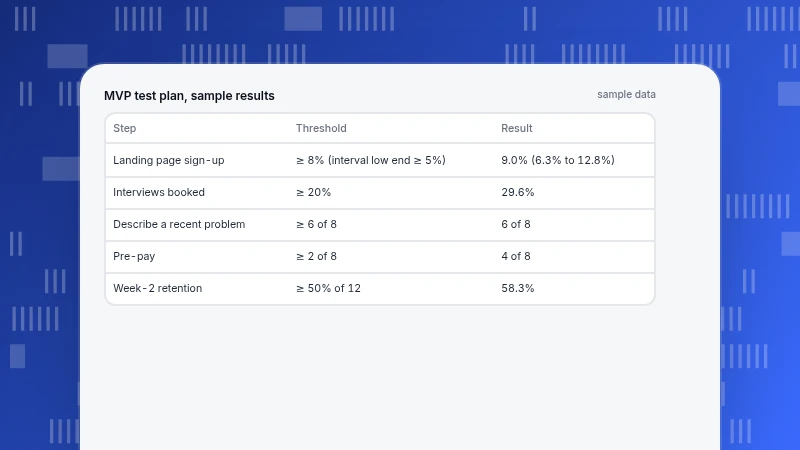
MVP Test: How to Validate an MVP With Real Users, Step by Step
How to run an MVP test with real users: pick the riskiest assumption, choose a test type, write a plan with hypothesis, metric, threshold and decision, and read small samples with confidence intervals.
Read more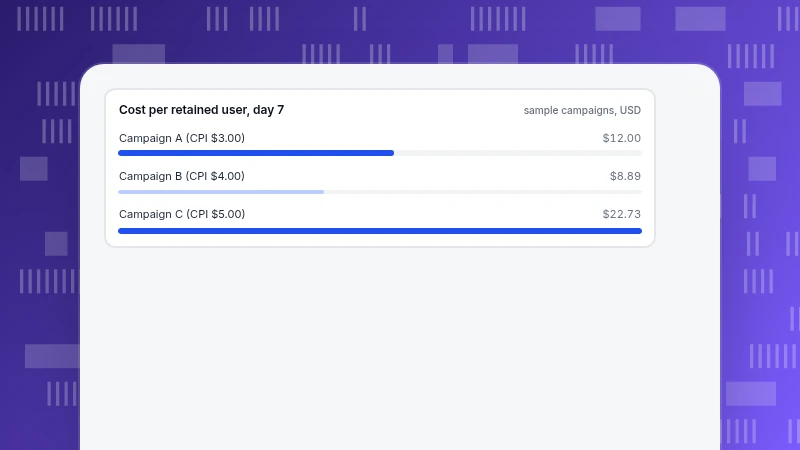
Mobile Advertising: Formats, Pricing Models and Measuring Installs
Mobile advertising explained through formats, pricing models (CPM, CPC, CPI) and how installs are measured, with a worked example showing why the cheapest install is not the cheapest retained user.
Read more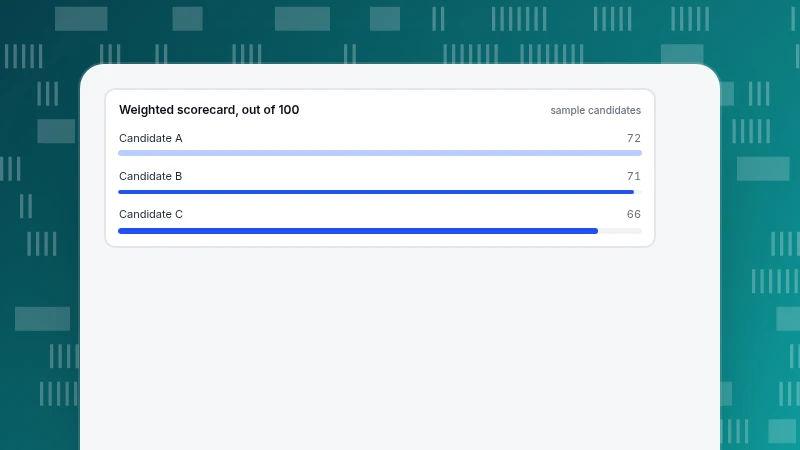
Live Chat Services: How to Choose One With Criteria, Pricing Math and a Scorecard
Live chat services compared without ranking brands: the three kinds, a criteria table with tests, a per-seat versus per-conversation break-even, a weighted scorecard and a seven-day trial plan.
Read more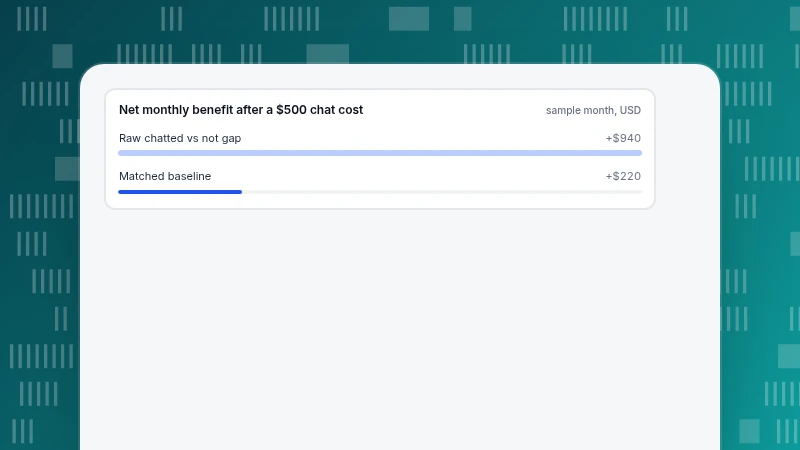
Benefits of Live Chat: What It Delivers and How to Measure Each One
The benefits of live chat, each paired with a metric, a formula and a data source: first response, abandoned purchases, conversion (raw versus matched), cost per contact and after-hours coverage.
Read more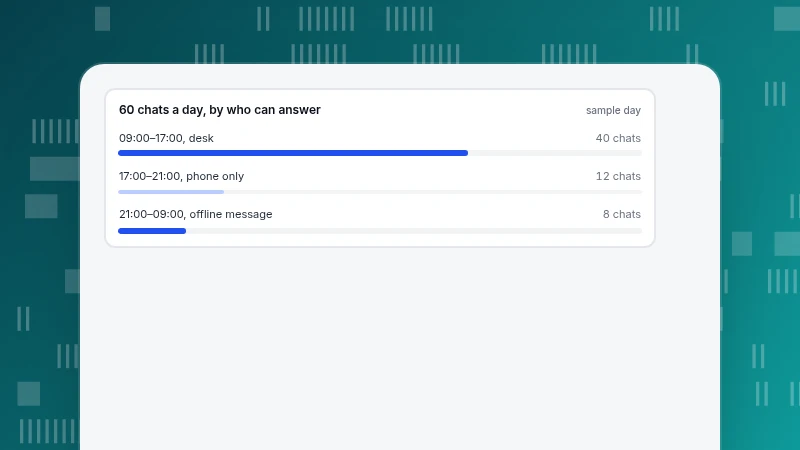
Live chat app: what the agent side must do when you answer from a phone
A live chat app is two things: the widget visitors see and the agent app your team answers from. Score the agent app on eight points: notifications, presence, offline path, canned replies, handoff, visitor context, roles and touch use.
Read more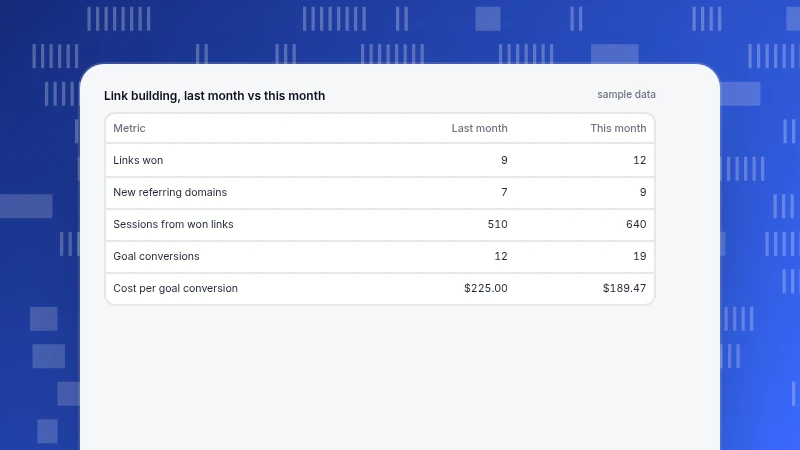
Link Building Report: Metrics to Include and a Template With Sample Numbers
What a link building report should contain: a filled-in monthly template (links won, referring domains, referral sessions, conversions, cost), the limits of Google's Links report and how to label paid links.
Read more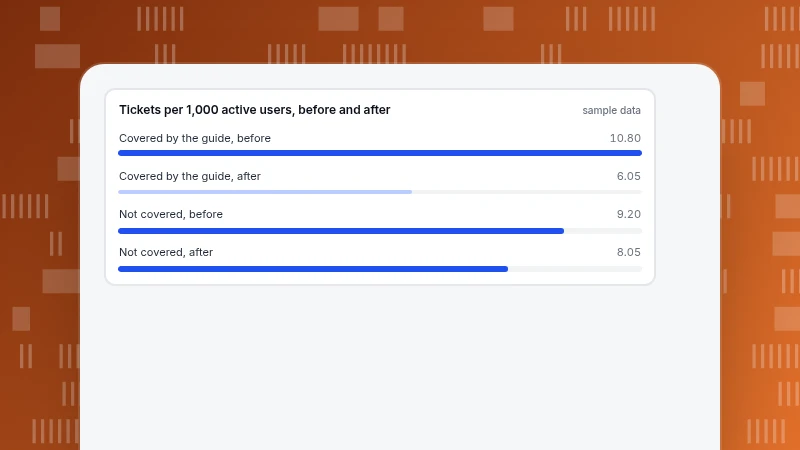
How to Write a User Guide: Structure, Annotated Outline and Testing
How to write a user guide that reduces support tickets: start from 90 days of tickets, use an annotated outline, write steps by Microsoft's rules, test with five people and measure the result per 1,000 users.
Read more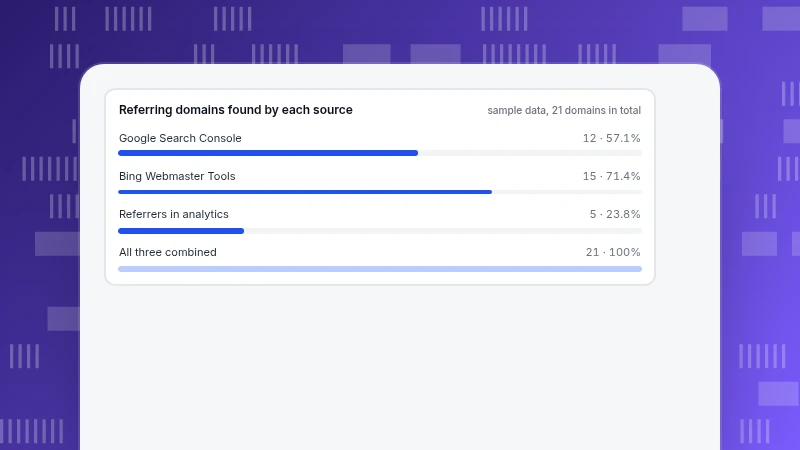
How to Find Backlinks to Your Website: 5 Free Methods
No free source lists every backlink, so combine them. Google Search Console, Bing Webmaster Tools, referrers, server logs and the Common Crawl web graph, with their documented limits and a merge that recovers links each tool misses.
Read more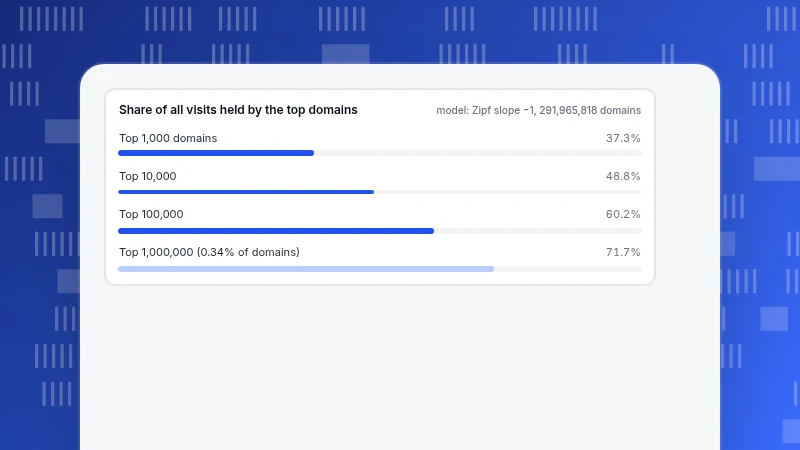
How Many Visitors Does a Website Get? A Rank-to-Traffic Model
Website traffic follows a steep curve: 96.55% of pages get no Google traffic while a few sites get billions of visits. A rank-to-traffic model, the noise at each size, and how to count your own visitors.
Read more
Confounding vs Lurking Variable: The Difference, With Worked Examples
A confounding variable is a measured third factor; a lurking variable is the same thing nobody measured. Two sample-data tables and the 1973 Berkeley admissions counts show how each one reverses or shrinks a headline gap.
Read more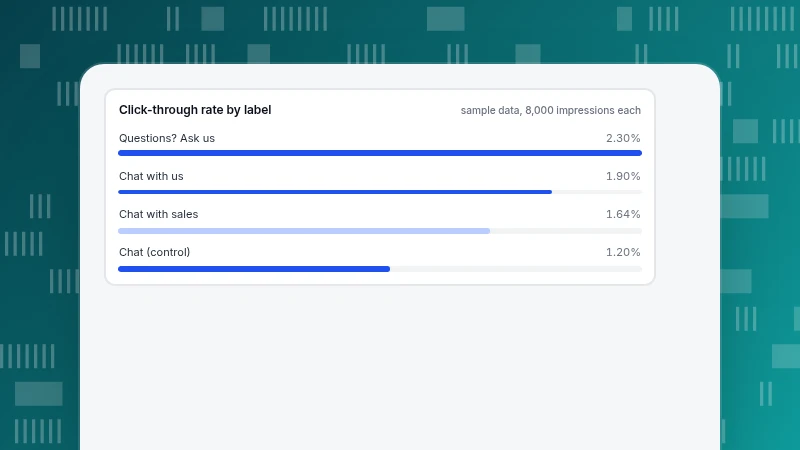
Chat With Us Button: Copy, Placement and How to Measure Clicks
A before-and-after test of four chat button labels with click-through arithmetic, the multiple-comparison threshold, clicks versus conversations, placement, size and contrast checks, and tracked button code.
Read more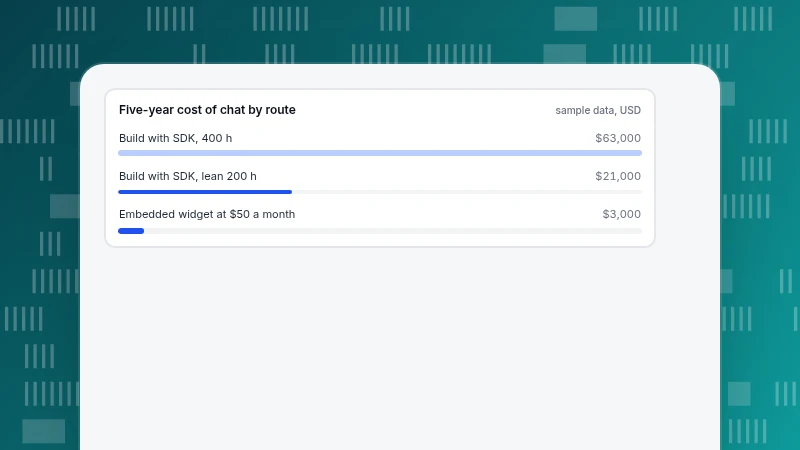
Chat SDK vs Chat Widget: How to Choose Between Building and Embedding
A chat SDK gives you the engine and you build the interface; a chat widget gives you the finished interface. A decision table, a five-year cost model, page-speed and accessibility checks, and six rules for choosing.
Read more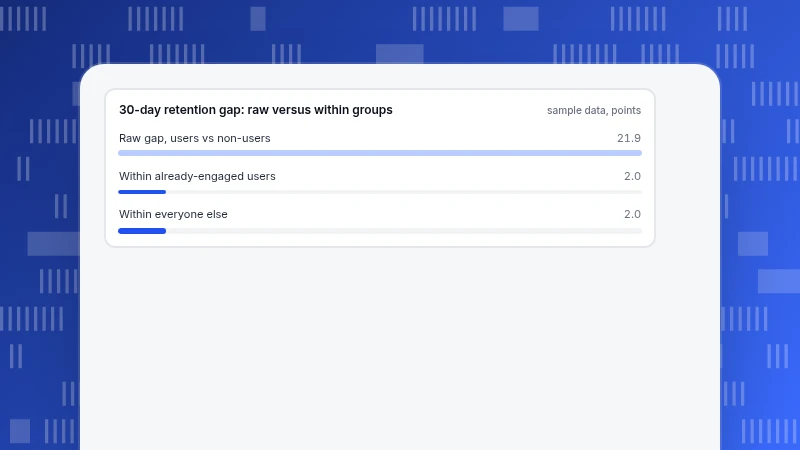
Causation Examples: What Evidence Separates a Cause From a Coincidence
Examples of causation from a randomized hormone trial, Bing's headline experiment and Facebook's ad studies, plus a worked product-analytics case where a 21.9-point retention gap is really 2 points, and a checklist for what you can claim.
Read more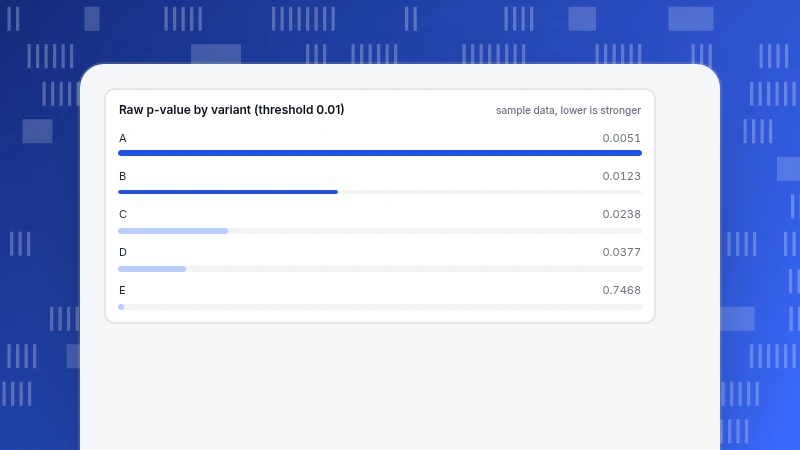
Bonferroni Correction Example: Five Variants and Adjusted Alpha
A worked Bonferroni correction example with a control and five variants: raw versus adjusted p-values, the 0.01 threshold, the extra traffic it costs, and how Holm keeps one more winner.
Read more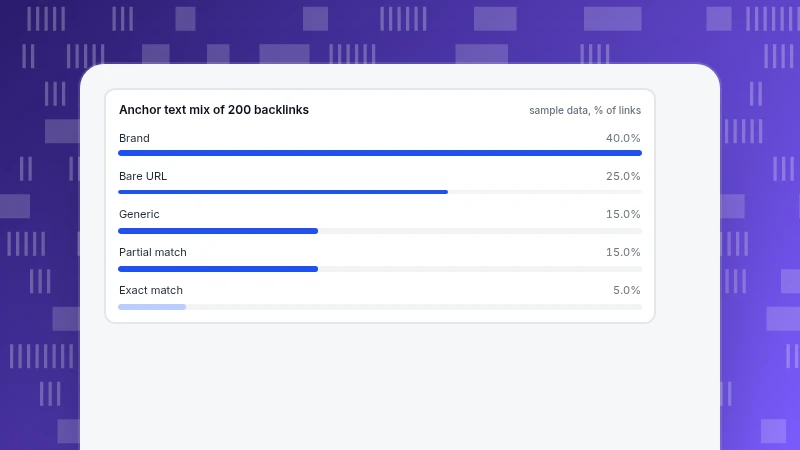
Backlink Examples: 8 Types With Real Link Code, Anchor Text and rel Values
Eight backlink examples with the actual HTML, anchor text and rel value for each: editorial, resource page, directory, forum, guest bio, sponsored, partner and image links, plus what Google counts as link spam and how to judge a link.
Read more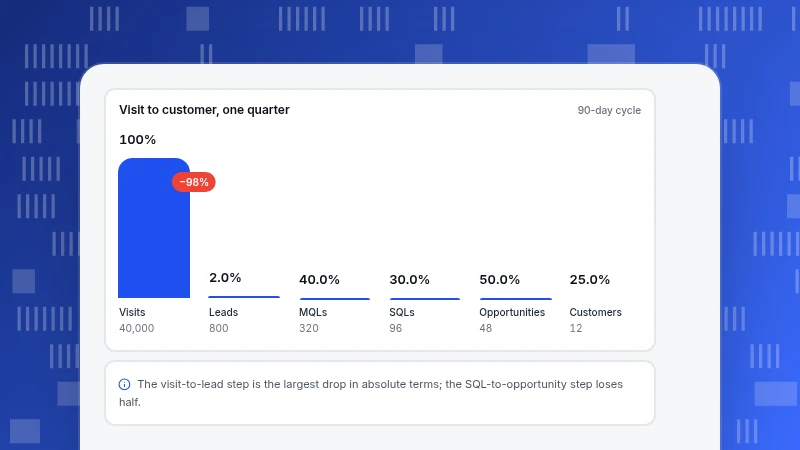
B2B Marketing Analytics: Metrics by Funnel Stage, With Formulas and Sample Numbers
B2B marketing analytics from visit to customer: one funnel table with formulas and sample numbers, CAC and payback, sales velocity, account-level metrics, attribution across a long cycle and the cohort trap in monthly reports.
Read more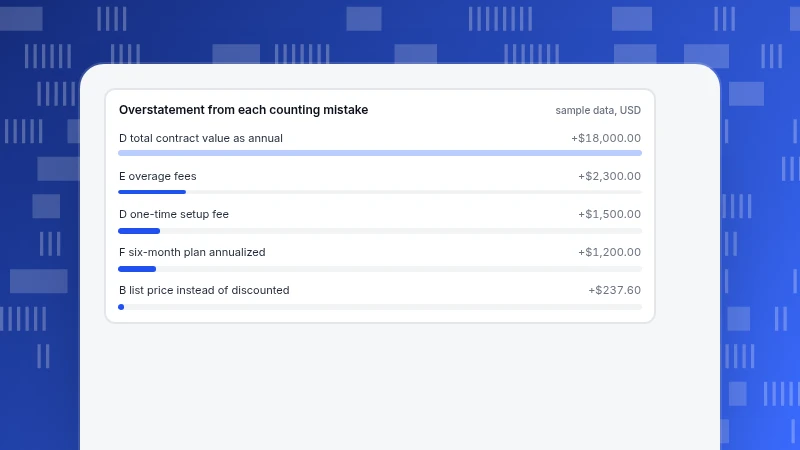
ARR Means Annual Recurring Revenue: How to Calculate It With Examples
ARR is the yearly value of the subscription revenue you expect to repeat. A seven-customer worked example handles discounts, monthly versus annual plans, multi-year deals and churn, and shows how each wrong choice inflates the number.
Read more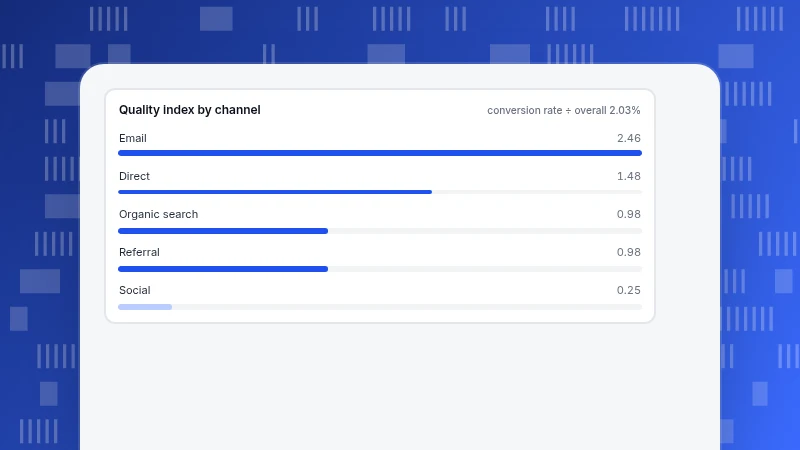
Website Traffic Analysis: A 3-Pass Method With a Worked Example
How to analyse website traffic in three passes: split visits by source, judge each source by engagement and conversion, then compare periods to see what moved. One sample you can recompute, a weekly routine and common mistakes.
Read more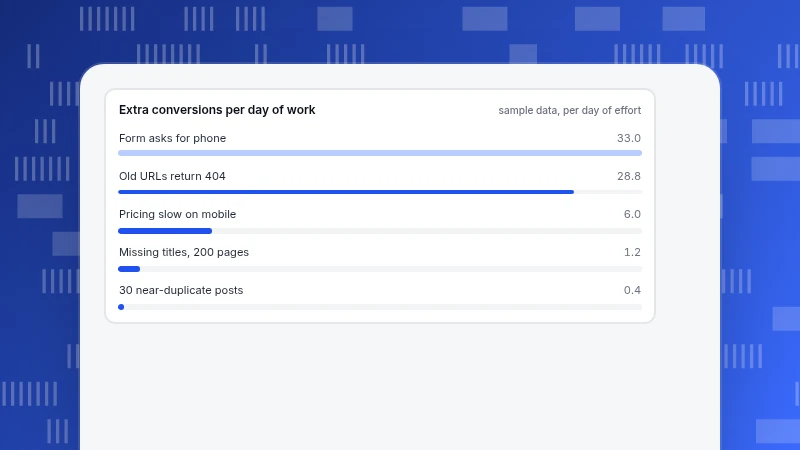
How to Audit Your Website: Technical, Content and Conversion Checks
How to audit your website in three layers, technical, content and conversion, then rank findings by expected extra conversions per day of work. Scope rules, a check table for each layer and a worked prioritisation example.
Read more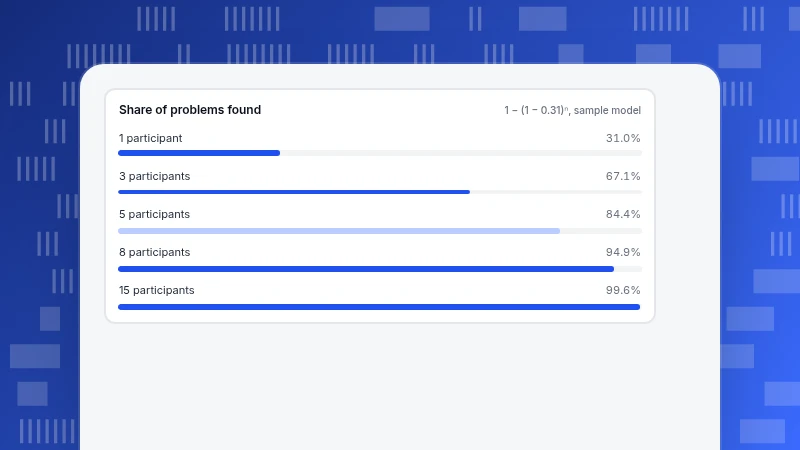
UX Testing: Which Method to Use, With How Many People
UX testing means watching real people attempt real tasks. Learn the three axes of methods, how many participants find problems versus measure them, and how to combine tests with behaviour data.
Read more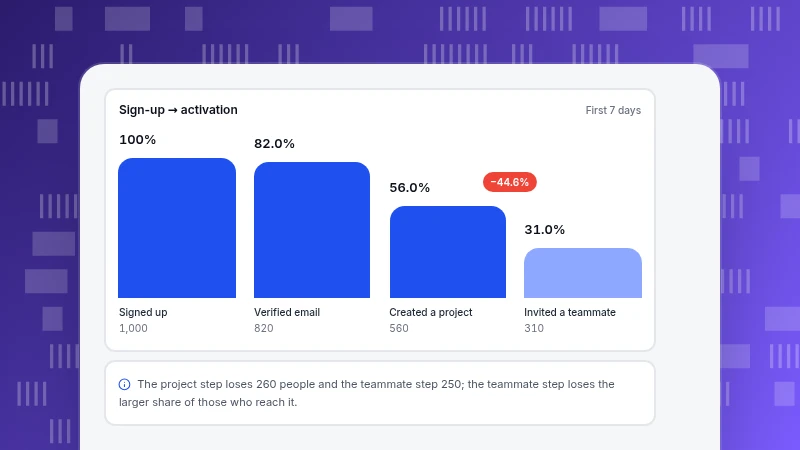
User Onboarding: Reach the Aha Moment Sooner, and Prove It With Data
User onboarding aims at one thing: getting new users to the aha moment sooner. Find it from retention data, run a funnel with step losses, pick methods by how much they interrupt, and check activation.
Read more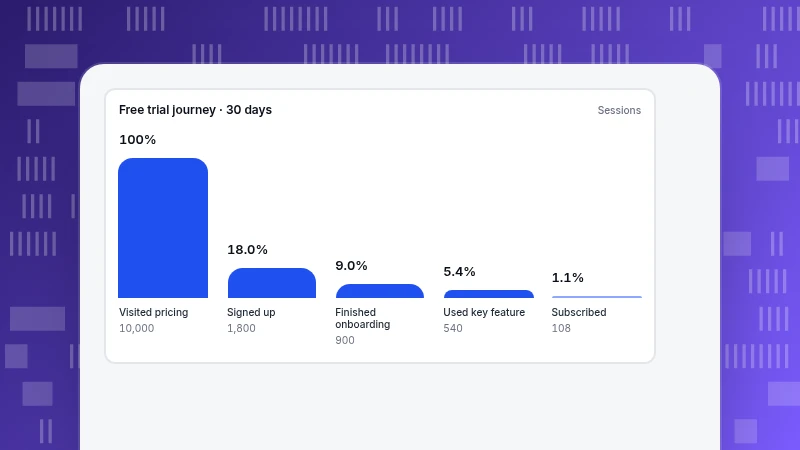
User Journey Map: 3 Worked Examples Built From Real Path Data
A user journey map shows the stages a person goes through to reach a goal. Three worked examples with recomputable reach, next-stage and friction numbers, plus a six-step build and common mistakes.
Read more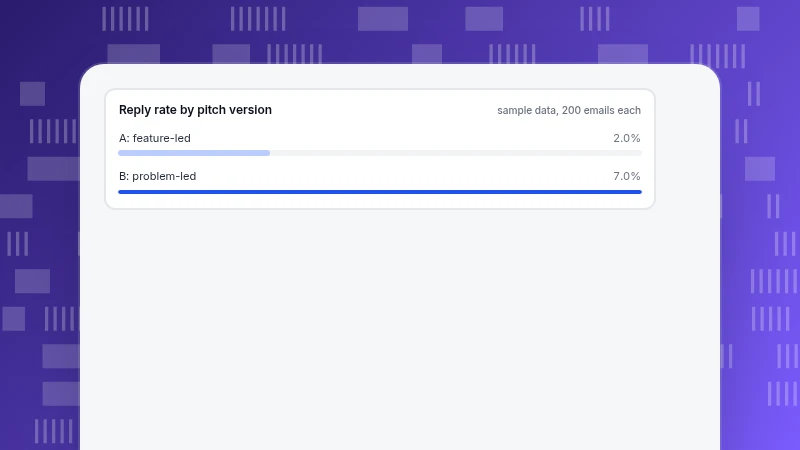
Sales Pitch Examples: Problem, Proof and One Next Step
Sales pitch examples for email, phone, elevator, website and follow-up, all built on one structure: their problem, your evidence, one next step. Includes a recomputed split test.
Read more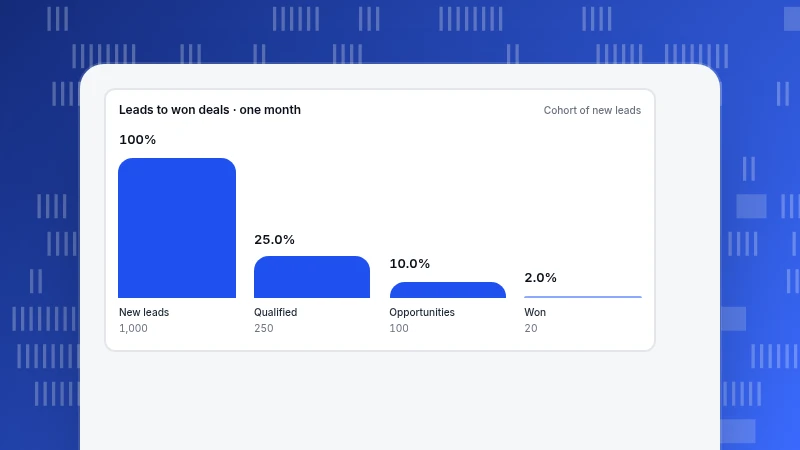
Sales Dashboard: The Four Metric Groups That Drive Action
What to put on a sales dashboard: four groups of metrics (leads, conversion, cycle, amount), formulas, a recomputable monthly example, a pipeline coverage calculation and views for rep, manager and executive.
Read more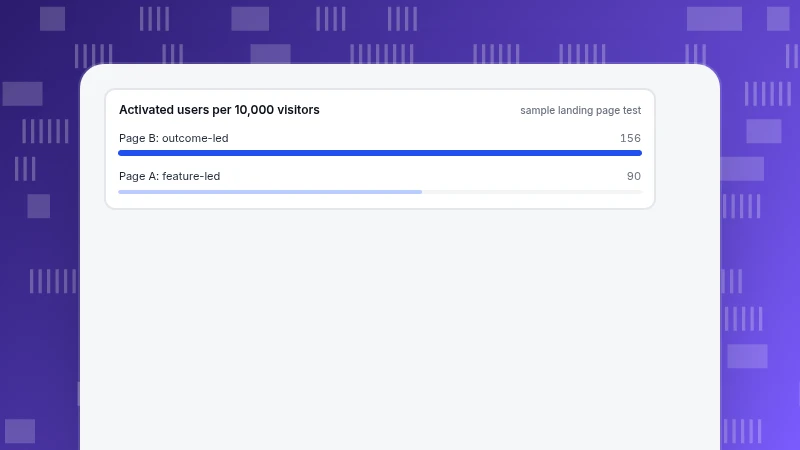
SaaS Product Marketing: Turn Features Into Outcomes and Test by Activation
SaaS product marketing turns each feature into a result the customer wants and tests the message by activation, not clicks. A feature-to-outcome pattern, a recomputable landing page test, launch adoption and TapCub steps.
Read more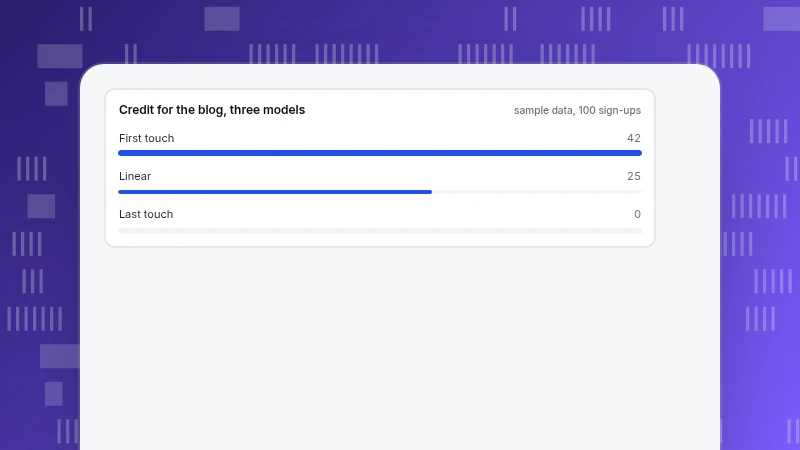
SaaS Content Marketing Strategy: Write for Problems Your Product Solves
A SaaS content marketing strategy built on product fit: score topics, map content to the buyer's stage and credit sign-ups with more than one attribution model. Recomputed examples included.
Read more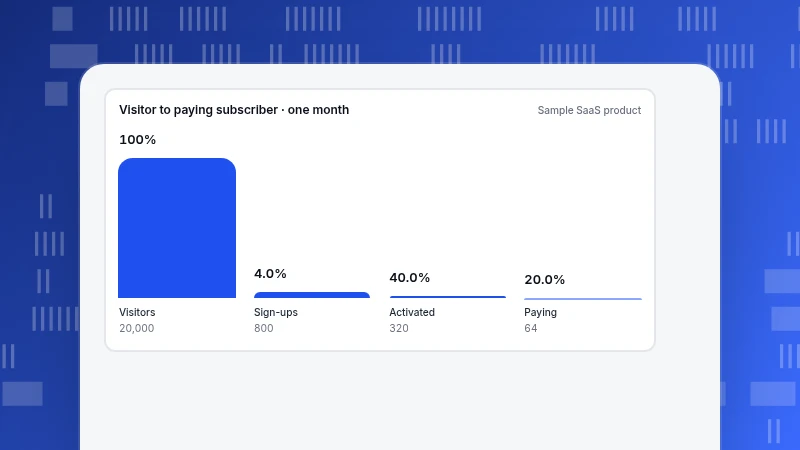
SaaS Analytics: Read Acquisition, Activation, Retention and Revenue in Order
SaaS analytics measures a subscription business in four stages with a few numbers each. One recomputable month of data, a cohort retention curve, net and gross revenue retention, and how to join product and billing data.
Read more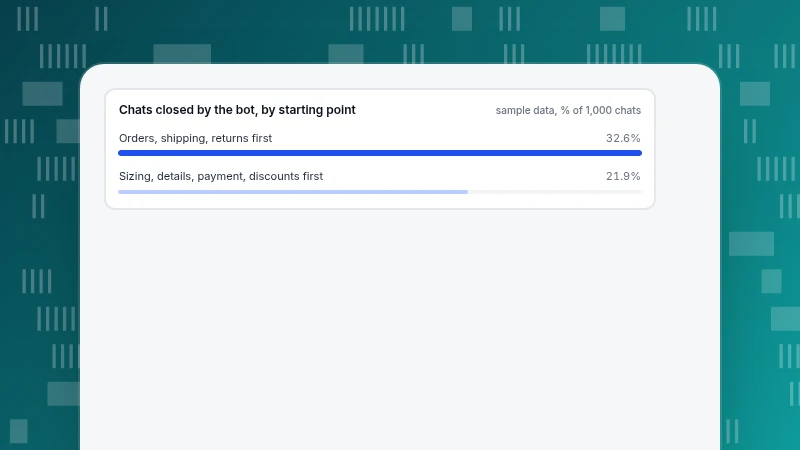
Retail Chatbot: Automate Orders, Shipping and Returns First
What a retail chatbot should handle first: orders, shipping and returns. Which questions need the order system, a worked month showing how many chats a policy-only bot can close, handoff rules and answer wording.
Read more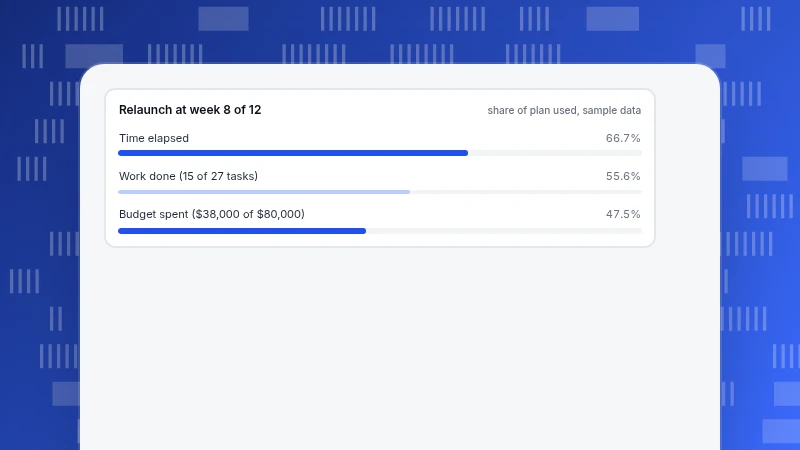
Progress Report: How to Write One People Read in a Minute
A progress report is a short update on work in progress. Put the status, decision and risk first, then the numbers. See a worked example at week 8 of 12 and a template you can copy.
Read more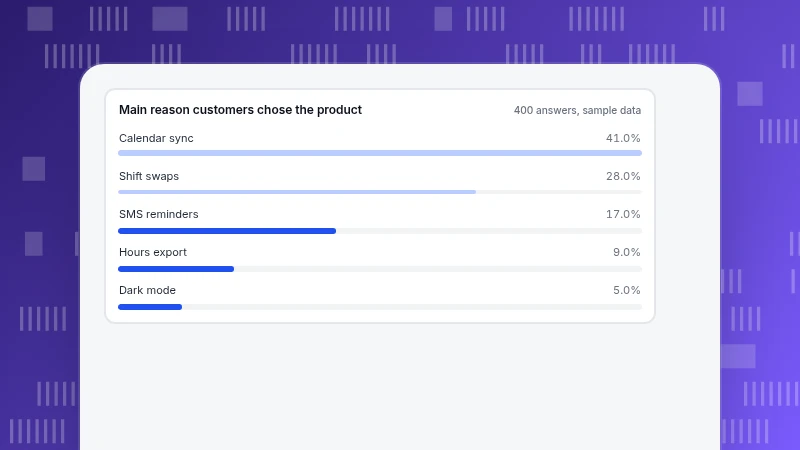
Product Features Definition: How to Describe Features Customers Choose
A product feature is a capability a customer can notice and use. Learn the difference from benefits and requirements, how to write one line per feature, and how to order the list by what makes people choose.
Read more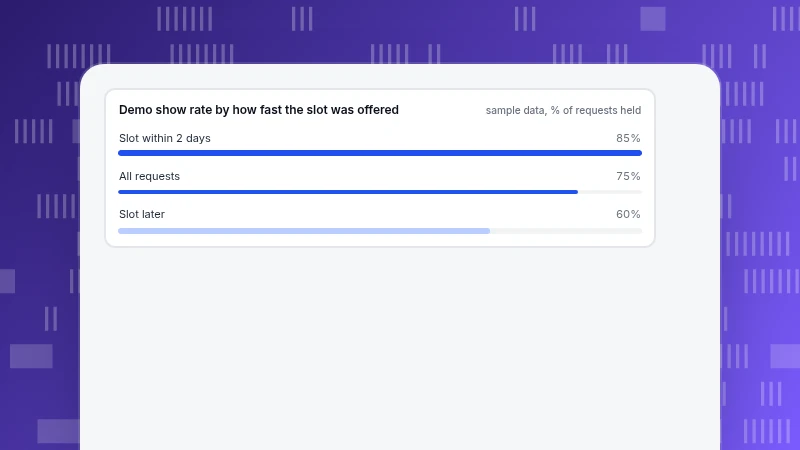
Product Demos: Show the Buyer's Scenario, Not Every Feature
Product demos work when the buyer sees their own scenario rather than a tour of features. Formats compared, a time-allocation example, discovery questions, a demo structure and a worked example of how scheduling speed changes results.
Read more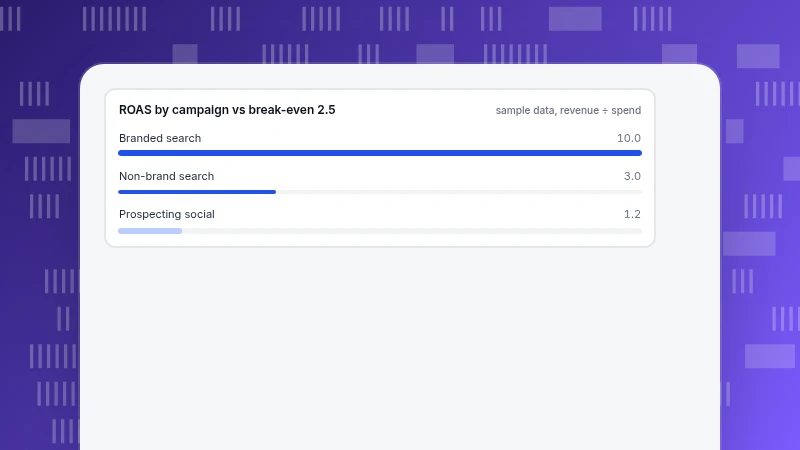
PPC Reports: How to Build One From Spend to Sale
A PPC report should run from spend to sale: what you spent, what it brought and whether it was worth it. The line-by-line chain, a three-campaign worked example with margin, why platform and analytics numbers differ and how to end with decisions.
Read more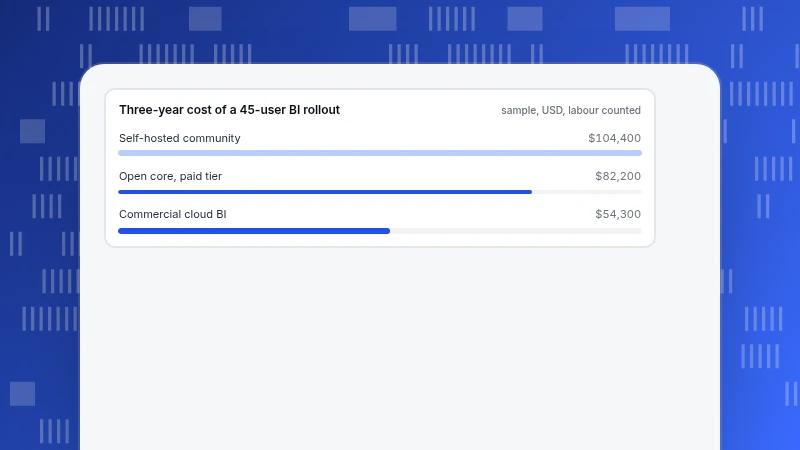
Open Source BI: The Hidden Costs of Sources, Permissions and Operations
Open source BI fits teams that have someone to maintain it. A ten-capability checklist, the hidden costs of data sources, permissions and operations, and a three-year cost that flips depending on whose hours are counted.
Read more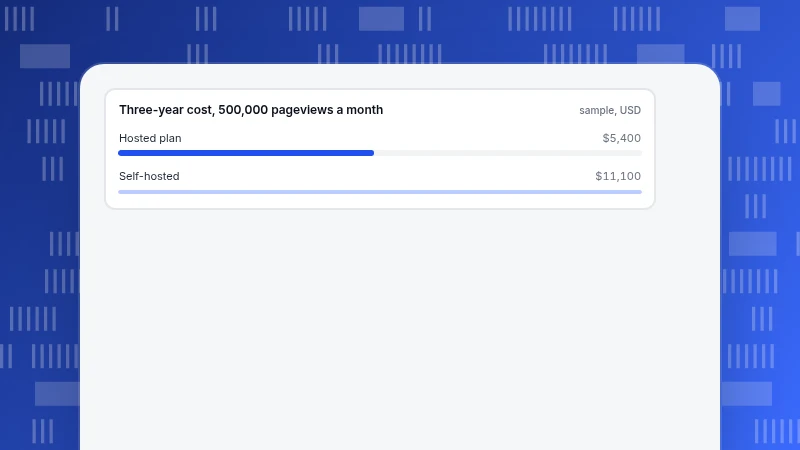
Open Source Analytics: Licence, Hosting and Data Protection Costs
Open source analytics saves licence fees but moves deployment, upgrades and data protection to you. A recomputable self-hosted vs hosted cost with a break-even, licence checks, GDPR duties and a five-step project check.
Read more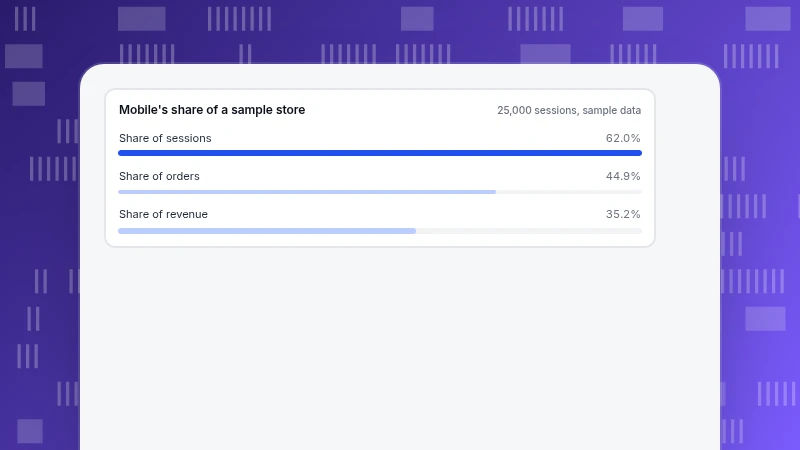
Online Shopping Trends: How to Read Them and Test Them on Your Store
Trend round-ups quote shares, growth rates and surveys as if they were the same thing. Learn a six-question checklist, what official U.S. figures show and how to test a trend on your own data.
Read more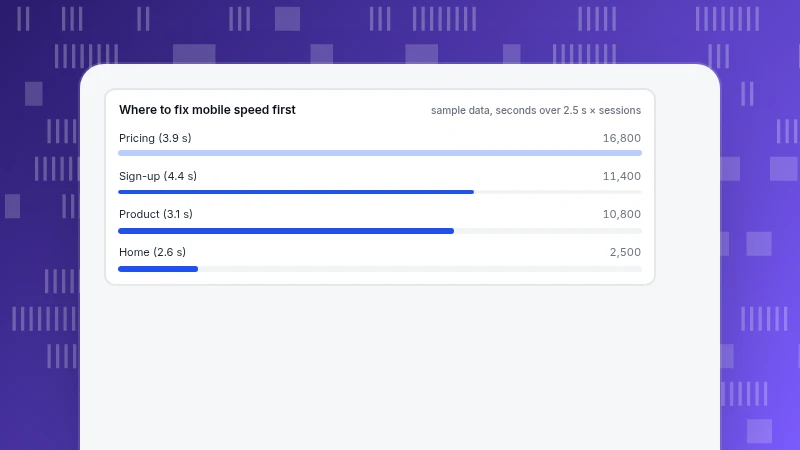
Mobile Search Engine Optimization: Rendering, Speed and Tap Checks
Mobile search engine optimization comes down to three checks on the phone page: is the content there, is it fast enough, can people tap and read it. Parity table, a worked speed-priority example and a ten-minute audit.
Read more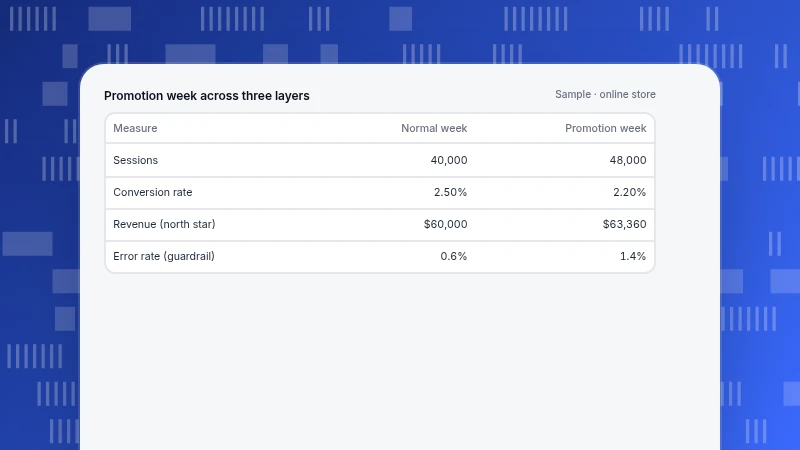
Metrics Dashboard: Arrange Metrics in Three Layers, Not One Wall
How to design a metrics dashboard: one north star, three to five input metrics that add up to it, and guardrails with thresholds. A recomputable promotion-week example, layout rules and common mistakes.
Read more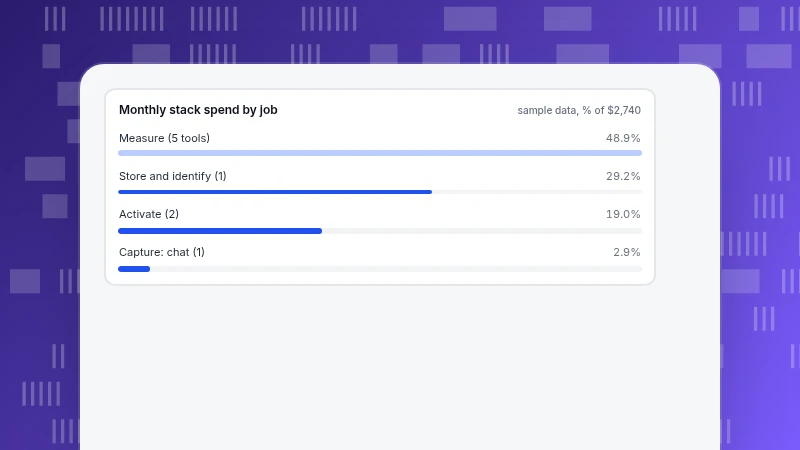
Marketing Technology Solutions: Map Your Stack by Data Flow
Marketing technology solutions are best organised by data flow rather than vendor. Four jobs, six flow questions, an hour-long mapping method, a nine-tool audit worked in numbers and a weighted scorecard for choosing the next tool.
Read more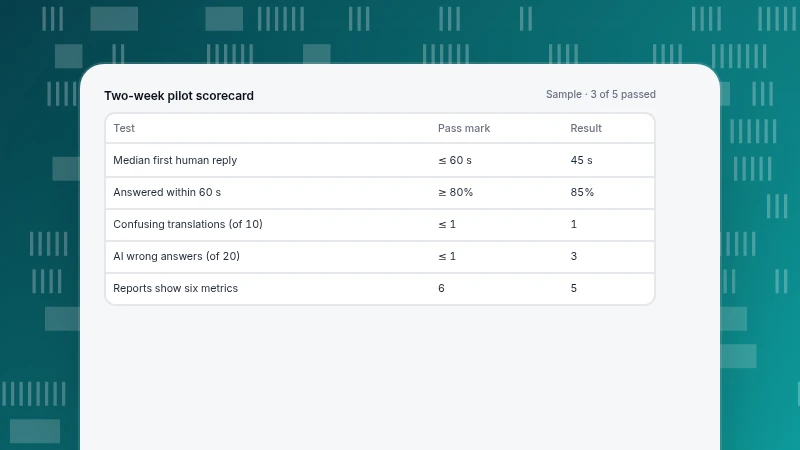
Live Chat Support Software: 4 Criteria and a Pilot With Pass Marks
How to choose live chat support software on response, languages, AI assistance and reporting. A staffing formula, a translation test, a 20-question AI test with a wrong-answer limit and a two-week pilot scorecard.
Read more
Landing Page Optimization Tools: Four Types and When to Use Each
Landing page optimization tools fall into four types, each answering a different question: testing, heatmaps, session replay and form analytics. A sample-size calculation, a heatmap and a form example, and a sensible order to add them.
Read more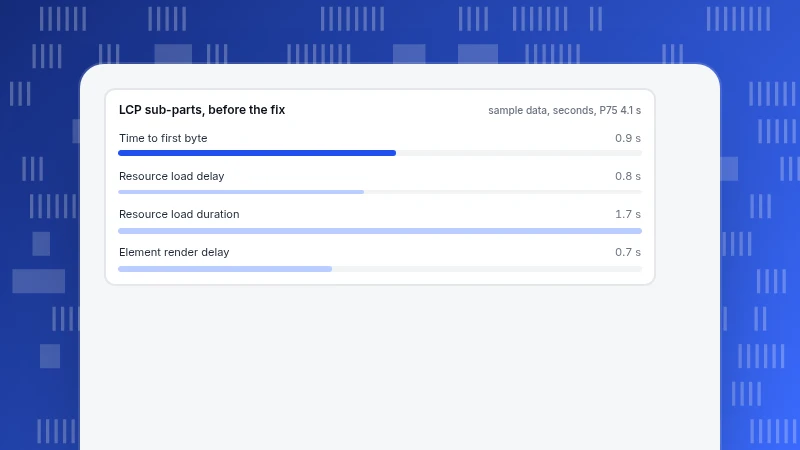
How to Optimize Website Performance: Measure, Find the Slow Part, Fix It
How to optimize website performance in a fixed order: measure real users at P75, rank pages, split LCP into four parts, fix only the part that is out of proportion and verify. Recomputed example included.
Read more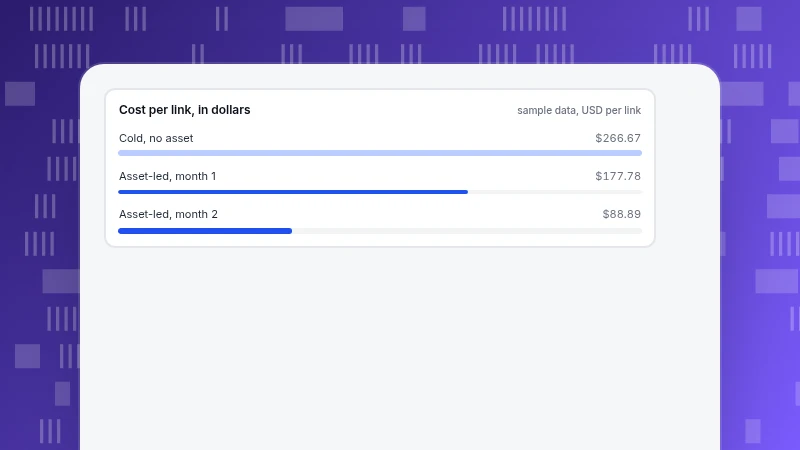
How to Get Backlinks: 8 Ways Ranked by Effort and Risk
How to get backlinks by giving people a reason to link: which links count, eight methods ranked by effort and risk, a worked cost-per-link example and how to check whether a new link worked.
Read moreFive categories, one question each
Each category answers a recurring question we hear from customers. Start with the one closest to your job.
Analytics
Definitions, funnels, retention and the data-quality questions behind every number.
304 articlesGrowth & Marketing
Acquisition, marketing, site and app operations, and how to pick the one stage worth fixing first.
238 articlesLive Chat
Proactive invites, translation and turning support conversations into conversions.
78 articlesAI Search
GPTBot, ClaudeBot, PerplexityBot: who fetches your pages, what the files say and what comes back.
39 articlesProduct News
What shipped, why we built it that way, and how to turn it on.
64 articles