Blog Analytics, growth and chat, explained with real numbers · Page 7
Practical notes from the team building TapCub: how metrics are defined, where funnels break, what AI crawlers take from your site, and how support teams turn conversations into conversions.
Browse every article
Filter by category or search a keyword. Every article links to the report or setting it talks about.
723 articles · page 7 of 16
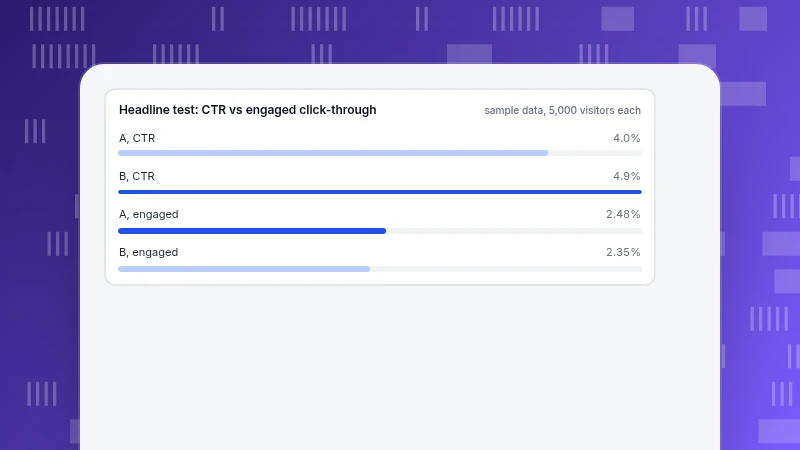
Headline Examples: What Works, With a Test That Catches Clickbait
Headline examples by format with weak and stronger versions, seven formulas and a metric ladder. A recomputed test shows how the raw click-through winner can lose once engagement is counted.
Read more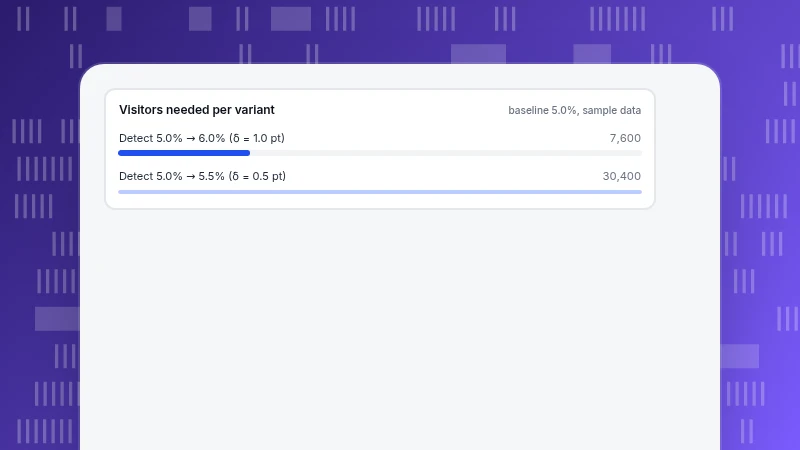
Growth Engineering: How to Turn Growth Ideas Into Testable Changes
Growth engineering uses code and experiments to move funnel metrics. See the loop, how long a test must run for a given lift, how to score a backlog and how to measure results.
Read more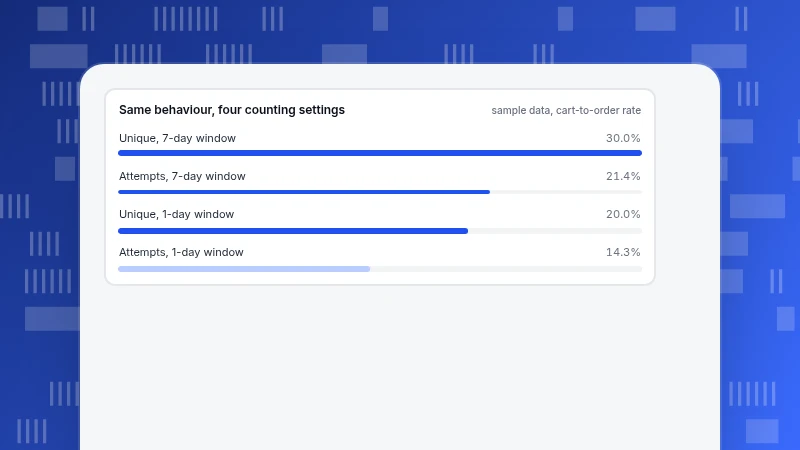
Funnel Analytics Tools: Criteria That Change Your Funnel Numbers
How to choose funnel analytics tools by three capabilities: flexible step definitions, group splits and drill-down. A criteria table, two recomputed examples and a 14-day trial plan.
Read more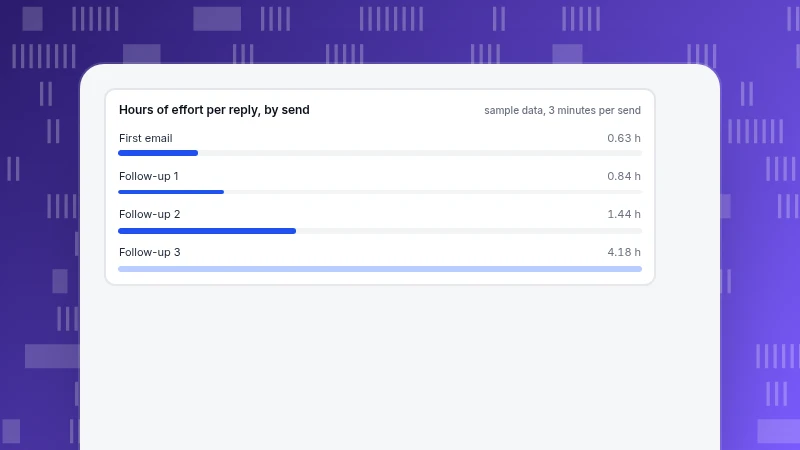
Follow-Up Email After No Response: Samples and a Three-Send Rule
How to send a follow-up email after no response: short, with something new and one clear action. Timing by context, five original samples, subject-line patterns, a worked sequence showing diminishing returns and when to stop.
Read more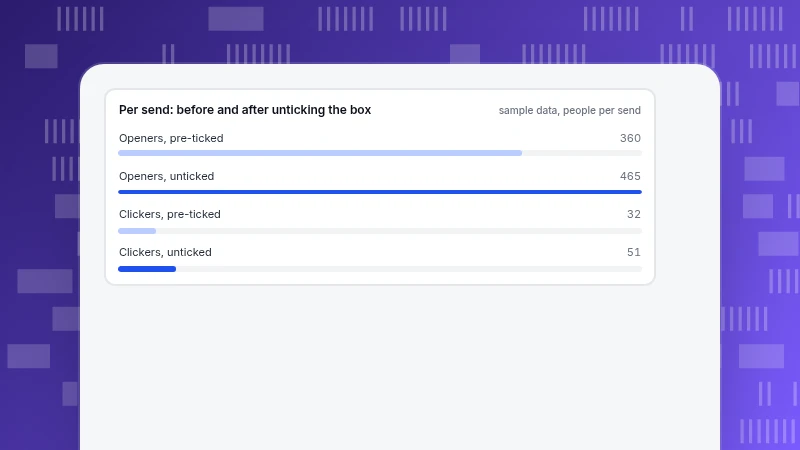
Ethical Marketing: Three Tests for Honest Claims, Consent and Design
Ethical marketing in practice: honest claims, consent for data, and no dark patterns. Claim and consent tables, an audit order and a worked example of what changes.
Read more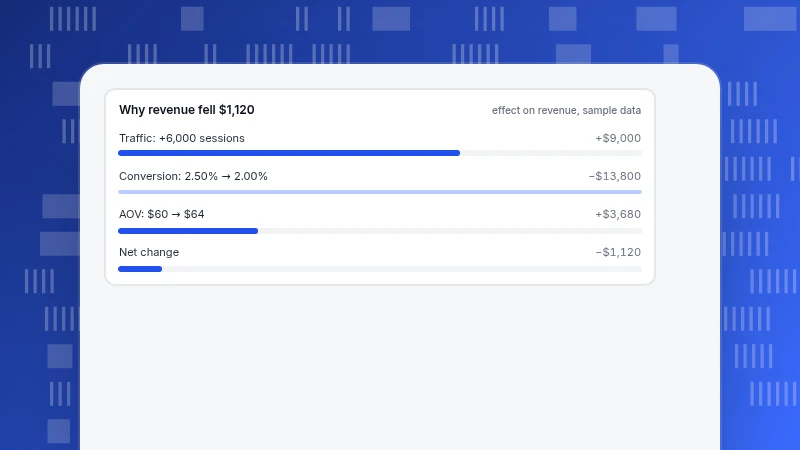
Ecommerce Data Analytics: Four Metric Families That Explain Revenue
Ecommerce data analytics comes down to traffic, conversion, basket size and repeat purchase. See how they multiply into revenue, with a sample revenue drop split by factor and channel.
Read more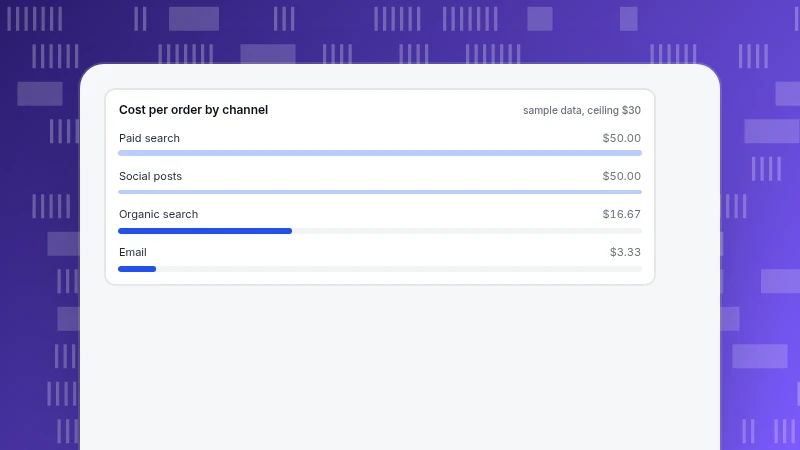
How to Create a Digital Marketing Strategy: From Goal to Review in Five Steps
How to create a digital marketing strategy in five steps: a goal with a number and date, backward arithmetic to visits, channels judged by cost per order, UTM tracking and a review rhythm with a cut rule.
Read more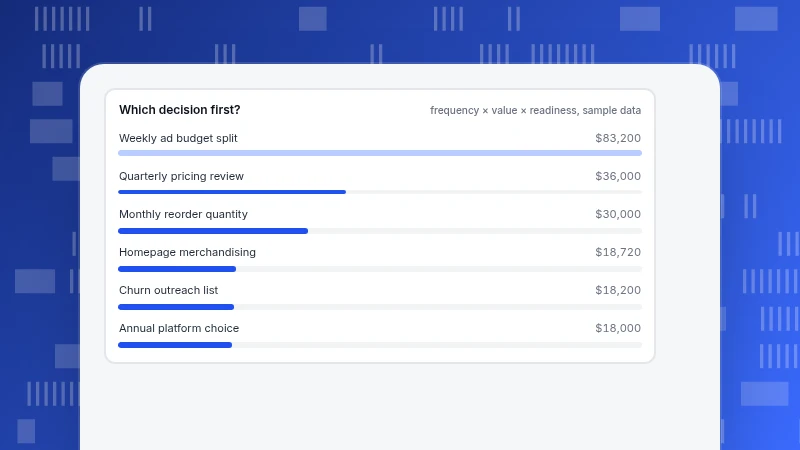
Data Analytics Strategy: A One-Page Plan Built Around Decisions
A data analytics strategy answers which decisions analytics serves, who owns each number and how you know it works. See a scored decision list, owner roles and a decision log you can copy.
Read more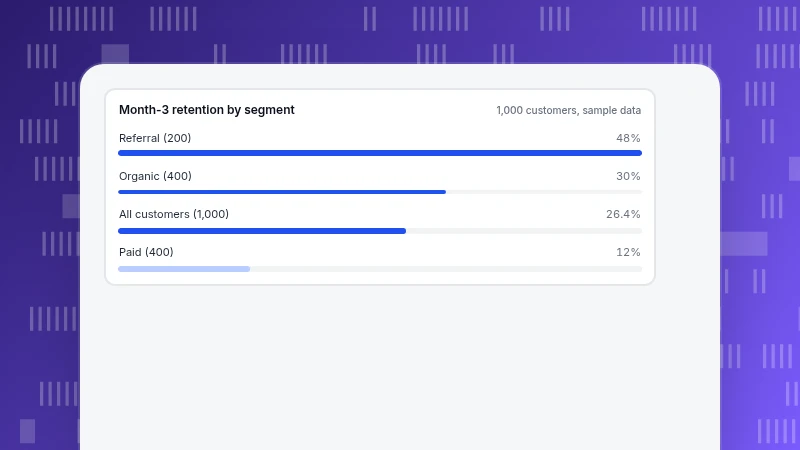
Customer Retention Analytics: Which Customers to Save First, and When
Customer retention analytics is not one rate; it is a segment-by-stage view that shows where customers are lost. See a worked example where an overall 26.4% hides 12% to 48%.
Read more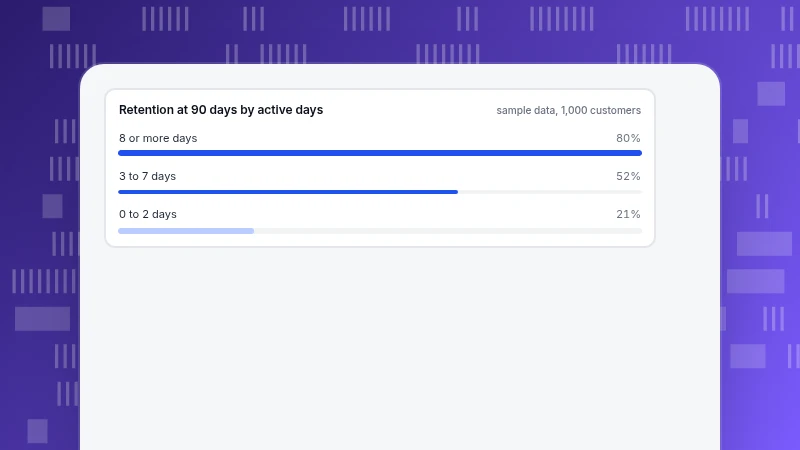
Customer Engagement Metrics: Track the Ones That Predict Retention
Customer engagement metrics grouped by activity, depth, sentiment and outcome, plus a test for which ones predict retention. A recomputed cohort shows 25% of customers producing 47.9% of revenue.
Read more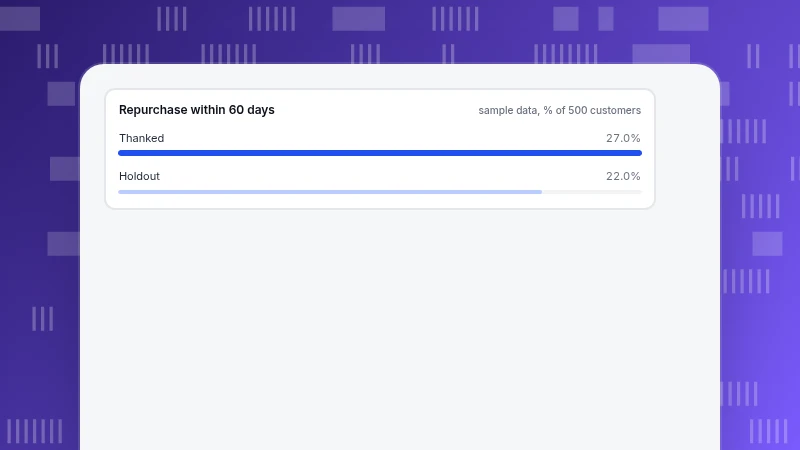
Customer Appreciation: Specific, Timely and Checked Against a Holdout
Customer appreciation works when it is specific, timely and judged by repeat behaviour, not compliments. Triggers and timing, gestures and their limits, and a worked holdout example showing a promising result that is not yet proven.
Read more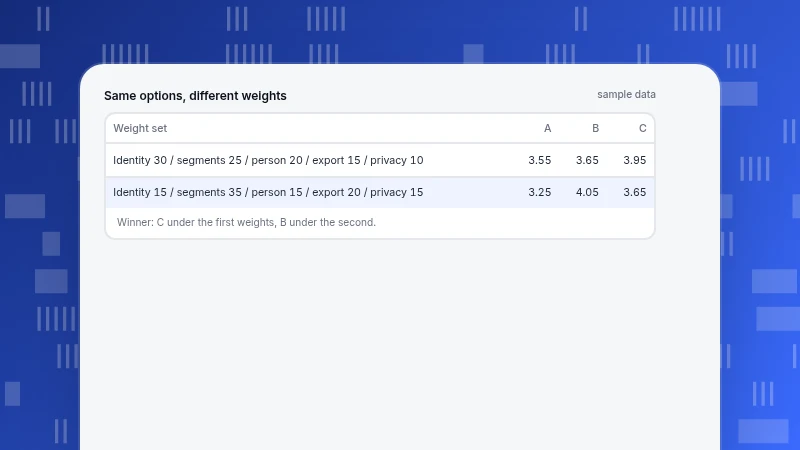
Customer Analytics Software: What to Check Before You Choose
Customer analytics software works on people, not page views. Check identity merge, segmentation and drill-down to one person, and see how weights can flip a scoring result.
Read more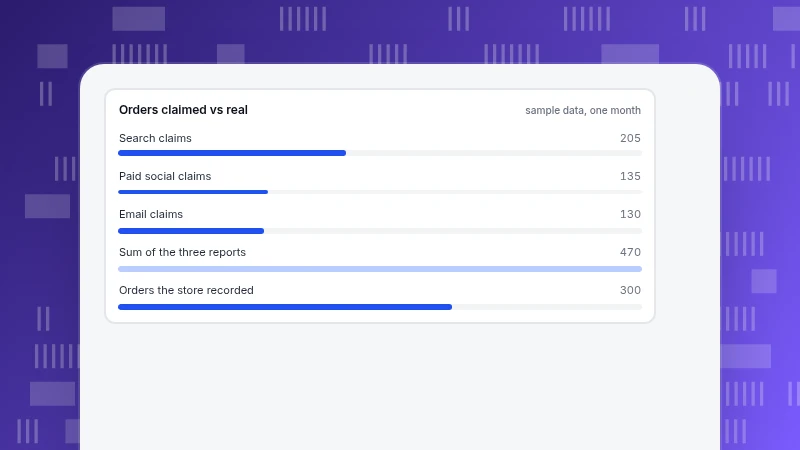
Cross-Channel Campaign Management: One Identity, One Set of Definitions, One Rhythm
Cross-channel campaign management means running one campaign across channels with shared audience and measurement. See why channel reports over-count (470 claimed vs 300 real) and how models change cost per order.
Read more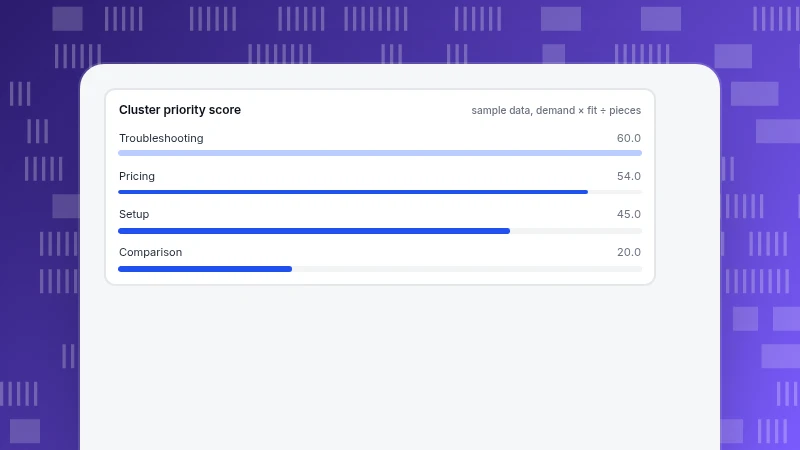
Content Planning: From Reader Questions to a Calendar You Can Finish
Content planning starts from topic clusters and real reader questions, then fits them to your capacity and a review rhythm. Cluster scoring, a capacity worked example, a calendar template and 30, 60 and 90-day review rules.
Read more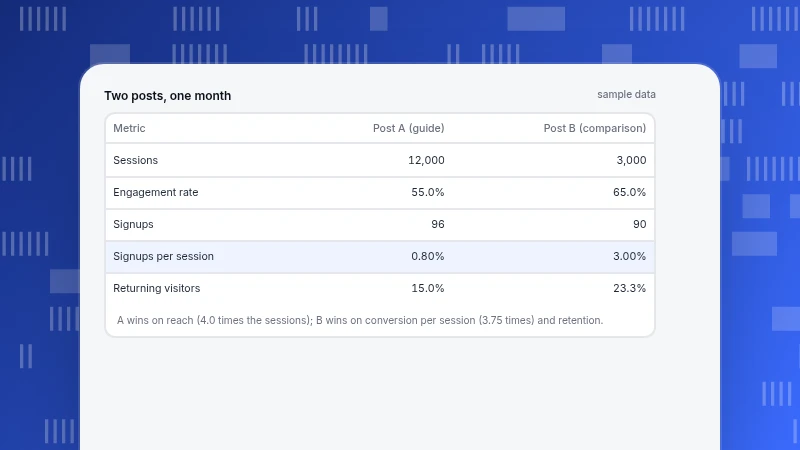
Content Metrics: Which Numbers to Use for Which Purpose
Content metrics fall into four purposes: reach, engagement, conversion and retention. Learn to pick one primary metric per piece, with a worked example of two posts that each win a different purpose.
Read more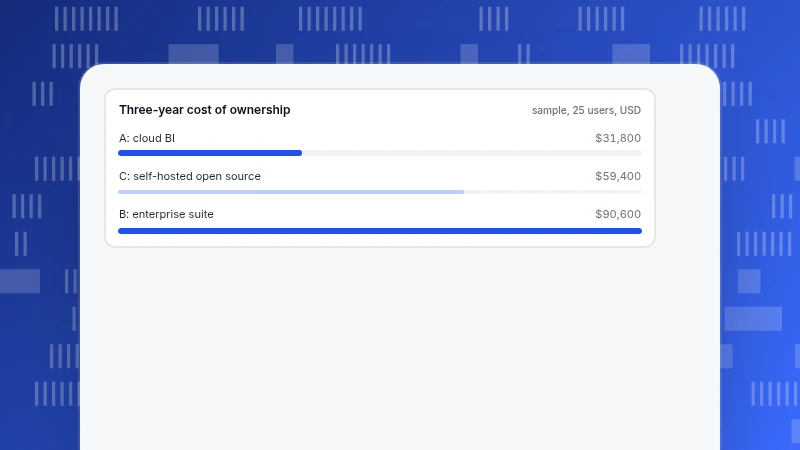
Business Analytics Software: How to Choose With 4 Criteria and a Scorecard
How to choose business analytics software on four criteria: data connection, modeling, collaboration and three-year cost. A recomputable cost table, a weighted scorecard that flips with the weights, and a two-week trial.
Read more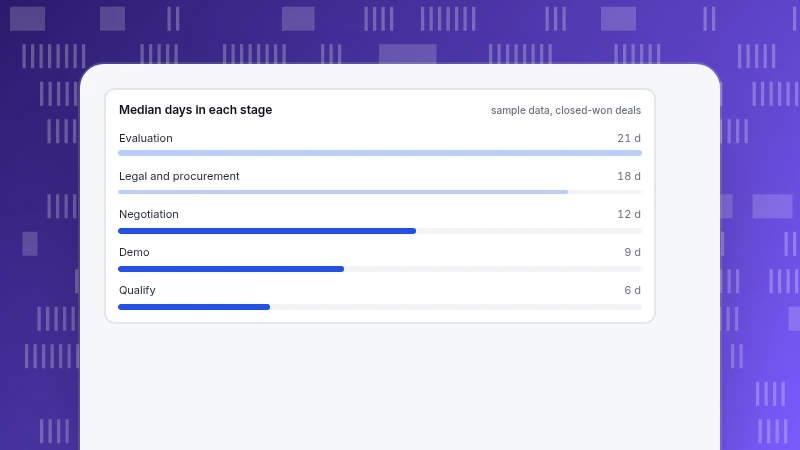
B2B Sales Cycle: How to Find the Stage Where Deals Stall
The B2B sales cycle only becomes useful when you split it into stages and find where deals wait longest. Mean versus median, open-deal bias, a stage-by-stage worked example, sales velocity and what your website can show before the cycle starts.
Read more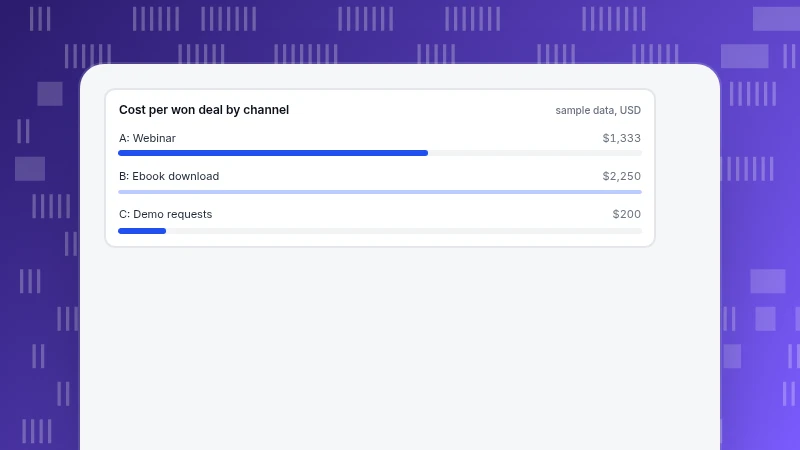
B2B Lead Generation: Judge Channels by Won Deals, Not Lead Count
B2B lead generation judged by quality: define a good lead by fit and intent, trace every lead from source to close and compare channels by cost per won deal. Recomputed three-channel example.
Read more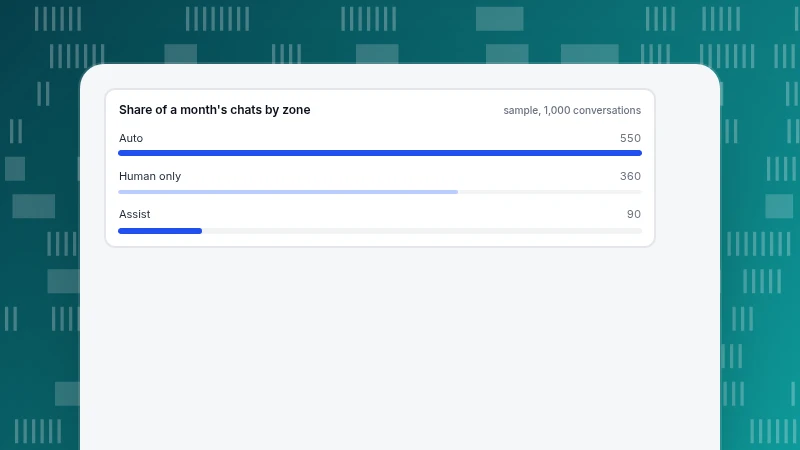
AI Live Chat: Set the Boundary Between Auto-Answers and Humans First
Before you switch AI live chat on, decide which questions it may answer alone and which must go to a person. Three zones, a recomputable month with a wrong-answer budget, handoff triggers and a five-step launch.
Read more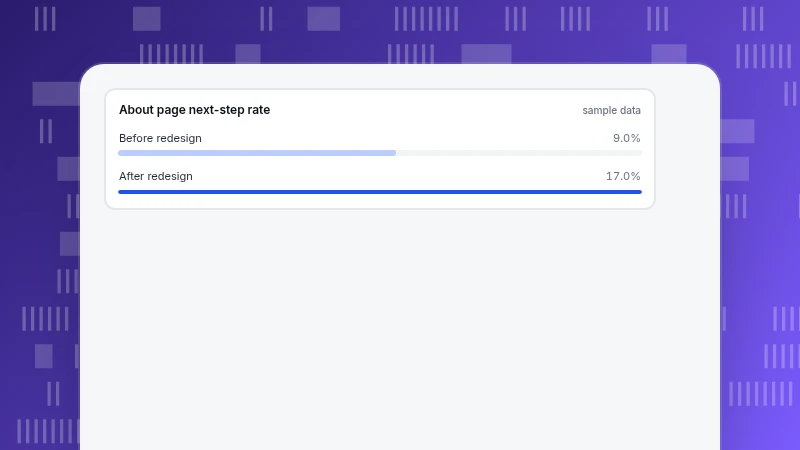
About Us Page Examples: What to Write, With Five Business Types
About Us page examples for five types of business, built on three questions every visitor asks: who you are, why to trust you and what to do next. With a rewrite table and a before/after measurement.
Read more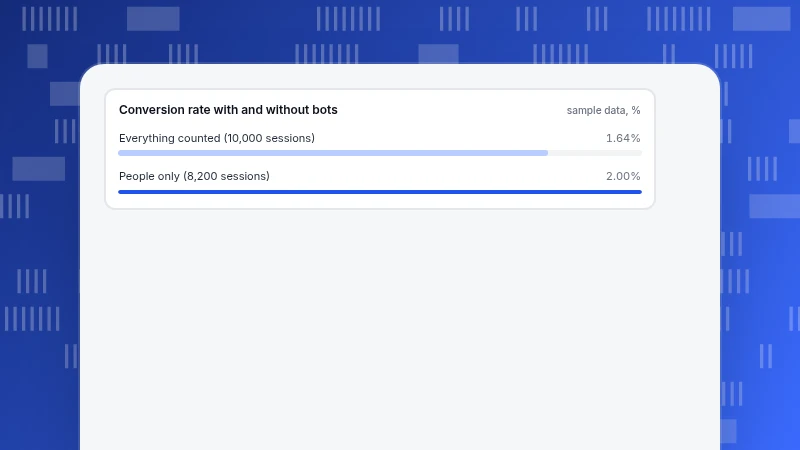
Website Traffic Statistics: How to Read the Numbers Behind Visitors, Sessions and Bots
Website traffic statistics depend on definitions: what counts as a visitor, how a session is cut, and whether bots are in. Worked examples on daily sums, bot inflation, session timeouts and noise, plus a test for published statistics.
Read more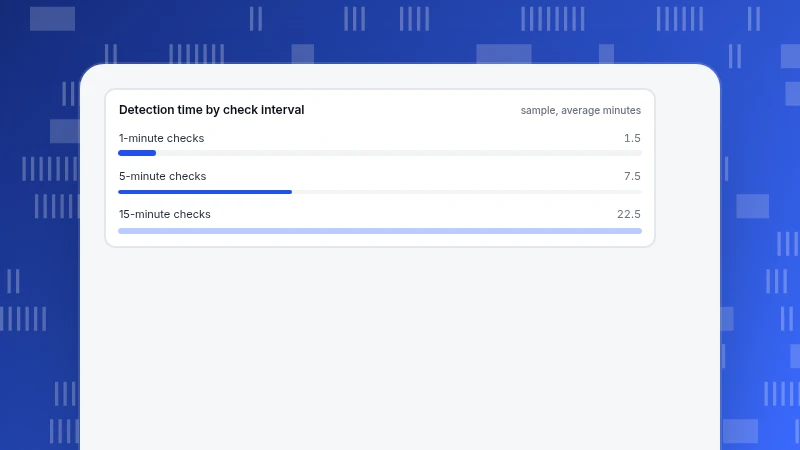
Website Monitoring: The Four Types and What to Alert On
Website monitoring covers availability, performance, errors and content, each needing its own check and alert rule. Synthetic vs real-user data, check-interval arithmetic, percentiles and thresholds set from history.
Read more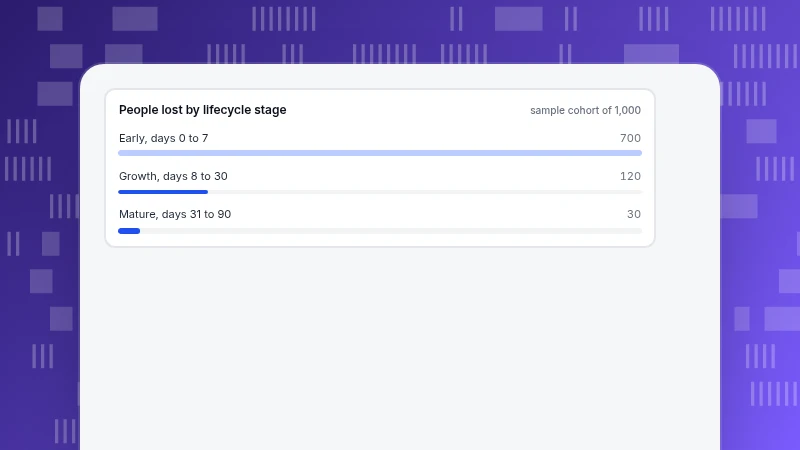
User Retention Strategies: What to Do at Each Lifecycle Stage
User retention strategies work best when matched to the user's stage: activation in days 0 to 7, habit in days 8 to 30, and dormancy and win-back after day 30. A cohort example shows which stage to fix first.
Read more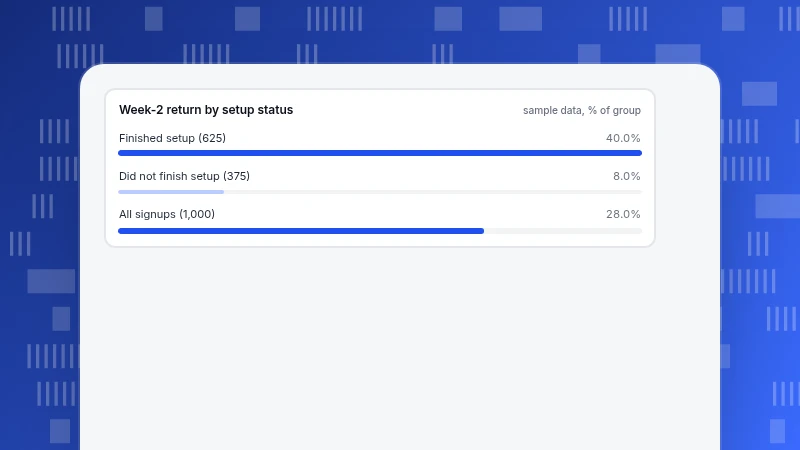
User Analytics: Who Uses Your Product, How, and How Well
User analytics answers three questions about the people using your product: who they are, how they use it and how well it works for them. Questions, prerequisites, a worked example from outcome to decision, and personal-data habits.
Read more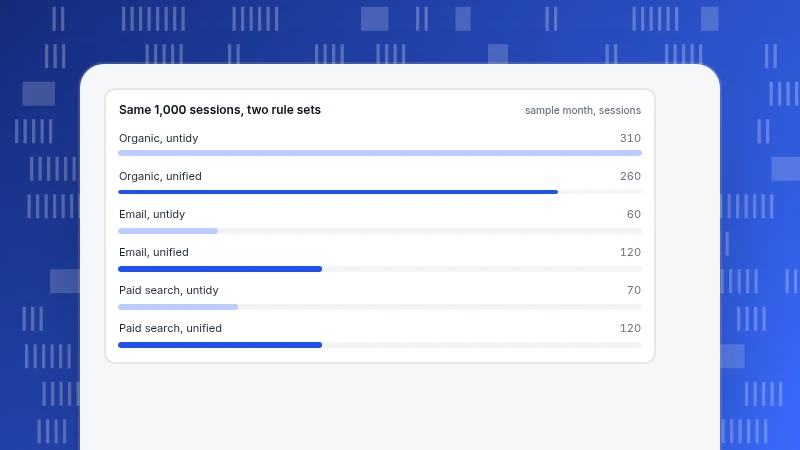
Traffic Sources: Types, and the Rules That Sort Visits Into Them
Traffic sources fall into direct, organic search, paid search, social, email and referral, but the label is assigned by rules, not by the visitor. The types, the rule order, a worked example and the mistakes that skew reports.
Read more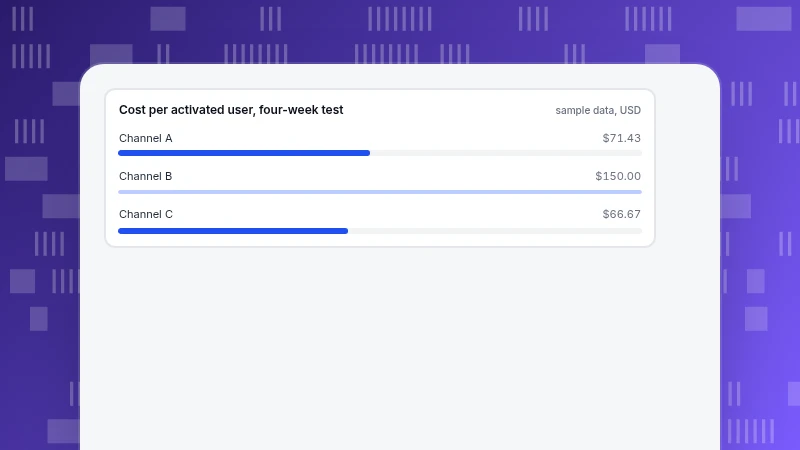
Startup Marketing: Pick Three Channels and Go Deep, Not Wide
Startup marketing works best when a small team picks three channels and runs fixed tests, not ten at once. Growth arithmetic, why small samples mislead, a scoring sheet and a four-week budget example.
Read more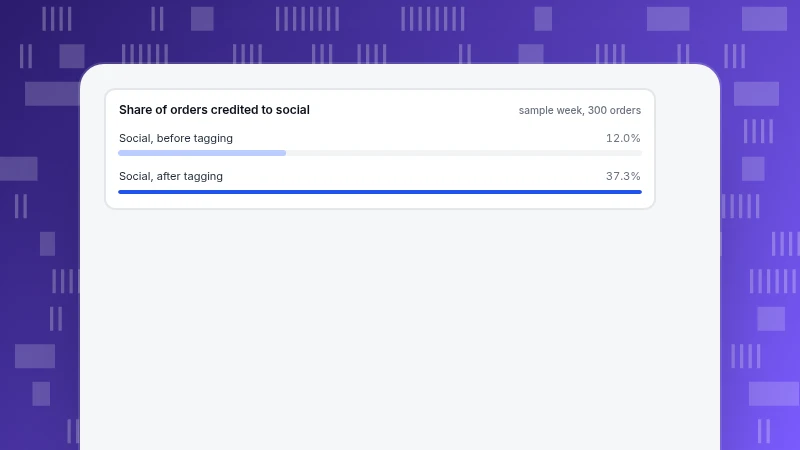
What Is Social Commerce? Models and How to Measure It
What social commerce is, the five main models and what your own analytics can see of each, plus a before-and-after example of tagging creator links and a margin-based view of creator spend.
Read more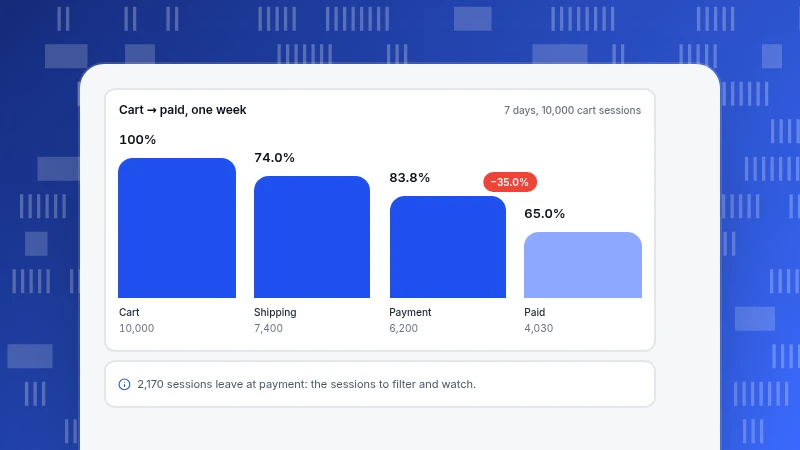
Session Replay Software: Uses, Limits and Privacy
Session replay software shows what one visitor did on a page. Learn when to use it, how many sessions to watch, what it does to privacy and how to choose, with a worked funnel example.
Read more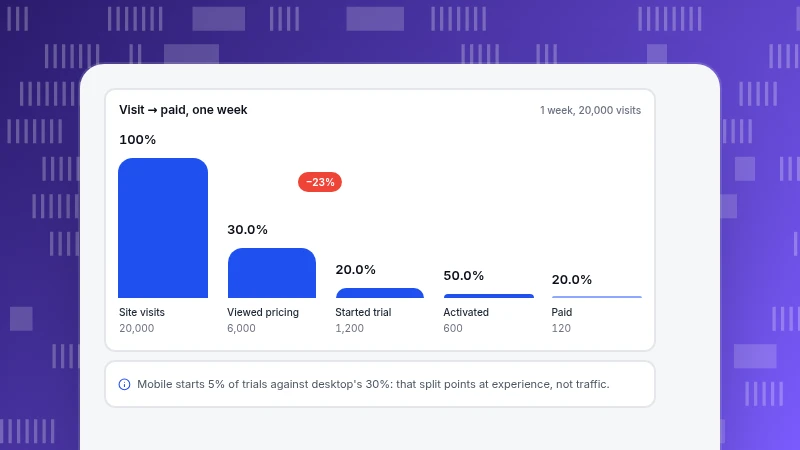
Sales Funnel Optimization: Find the Leak Before You Fix It
Sales funnel optimization starts with finding the step that got worse, then splitting it by source and device to tell traffic problems from experience problems. A recomputable example and a checklist of mistakes.
Read more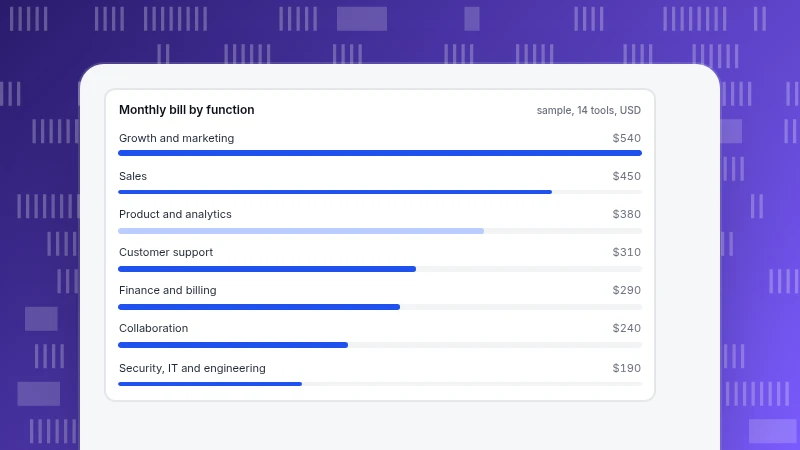
SaaS Tools: How to Build a Stack by Function
SaaS tools are the subscriptions a company runs on. Group them by function, decide before adding, audit overlap and idle seats, and retire tools safely, with a recomputed 14-tool example.
Read more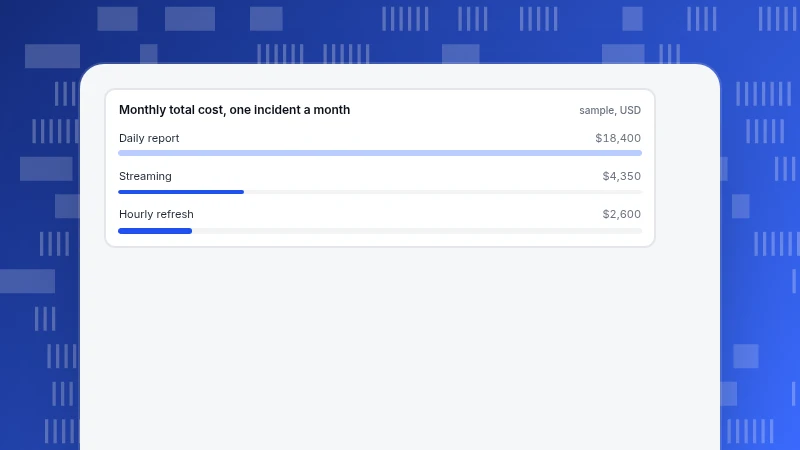
Real-Time Analytics Platforms: Do You Need One?
What real-time analytics platforms are, which decisions really need them, and how to work out break-even between daily, hourly and streaming data, with a worked cost example and vendor questions.
Read more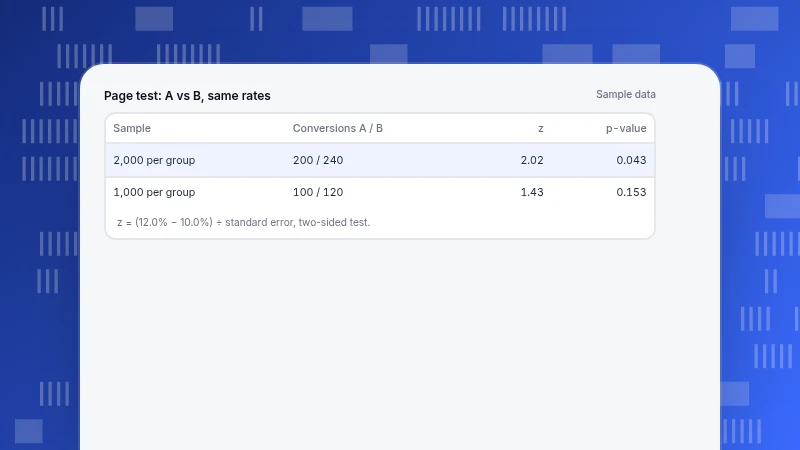
Quantitative Research Examples: Question, Sample and Test
Quantitative research examples that name the question, the sample and the test: three published designs, a survey sample-size calculation and a two-group comparison, all recomputable, plus a six-step design routine.
Read more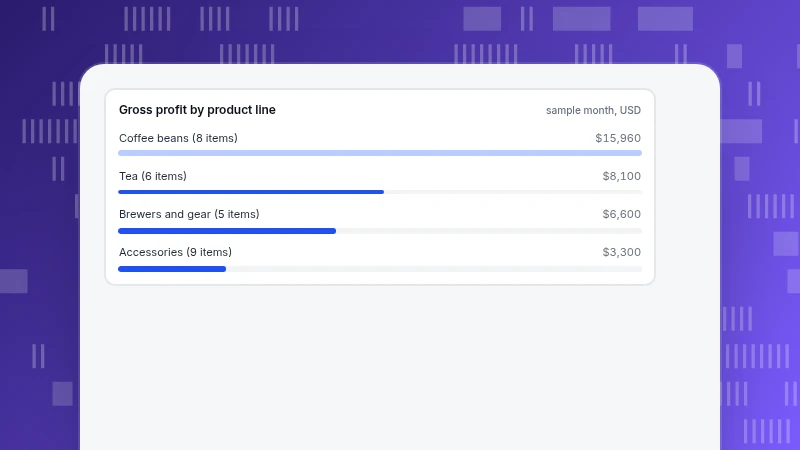
What Is a Product Mix? Width, Length, Depth and Consistency Explained
A product mix is all the lines and items a company sells. The four dimensions (width, length, depth, consistency), a four-line worked example with shares of revenue and gross profit, and how to decide what to widen, deepen, trim or tighten.
Read more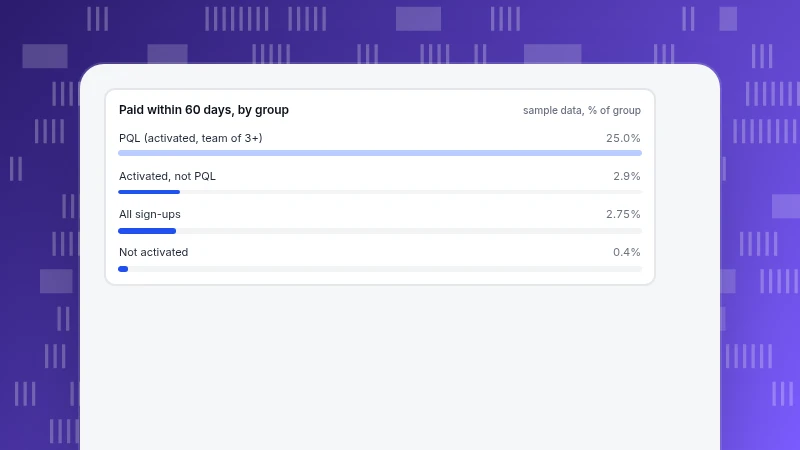
Product-Led Growth Strategy: Five Decisions and the Numbers to Check Them
A product-led growth strategy comes down to five decisions: entry, value, habit, spread and handoff. How to pick the activation event from data, define and test a product-qualified lead, and when PLG is a poor fit, with a worked funnel.
Read more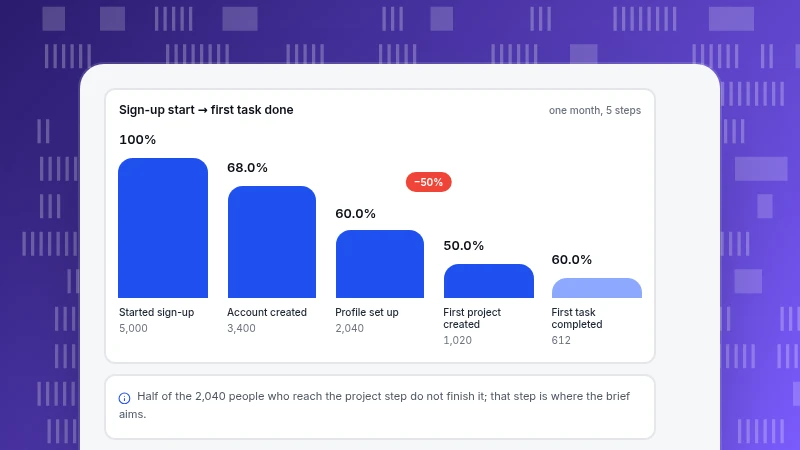
Product Design Process: Four Phases and the Data Each One Needs
The product design process in four phases (Discover, Define, Develop, Deliver), with the question, evidence and decision for each, a worked onboarding example and the 5-user test model worked out.
Read more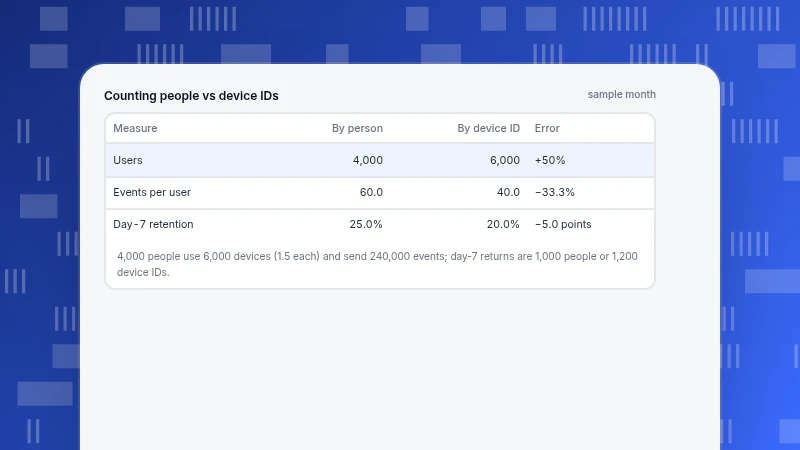
Product Analytics Platform: How to Choose One (Event Model and Identity First)
How to choose a product analytics platform: check the event model and identity first, run a two-week trial on one real flow and score candidates with weights. Includes a priced identity example and a weighted scoring worked example.
Read more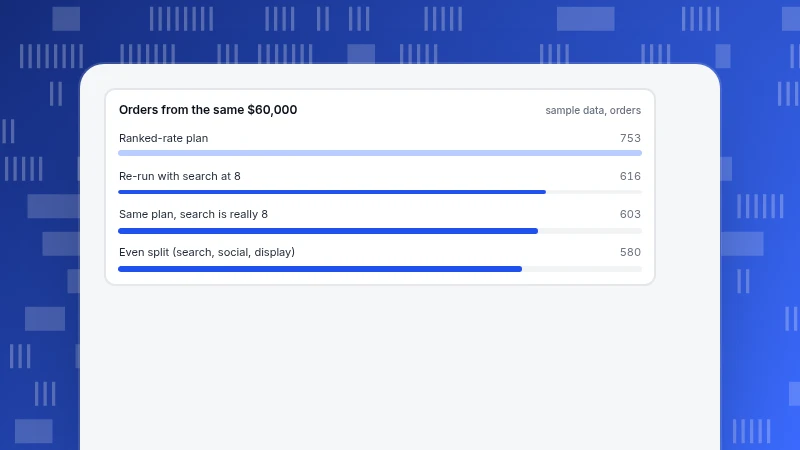
Prescriptive Analytics: What It Is, How It Works and Which Tools Fit
Prescriptive analytics recommends what to do from predictions, constraints and an objective. How it differs from descriptive, diagnostic and predictive analytics, a hand-worked budget example with a sensitivity case, and which kind of tool fits.
Read more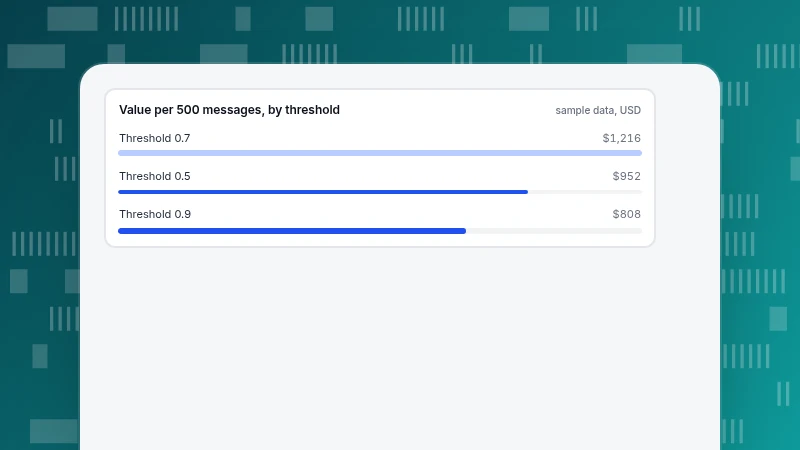
NLP Chatbot: How It Works and Where It Should Hand Off to a Person
An NLP chatbot reads what people mean instead of matching keywords. How intents and confidence scores work, how to decide what goes to a person, and how to test a threshold with a priced worked example.
Read more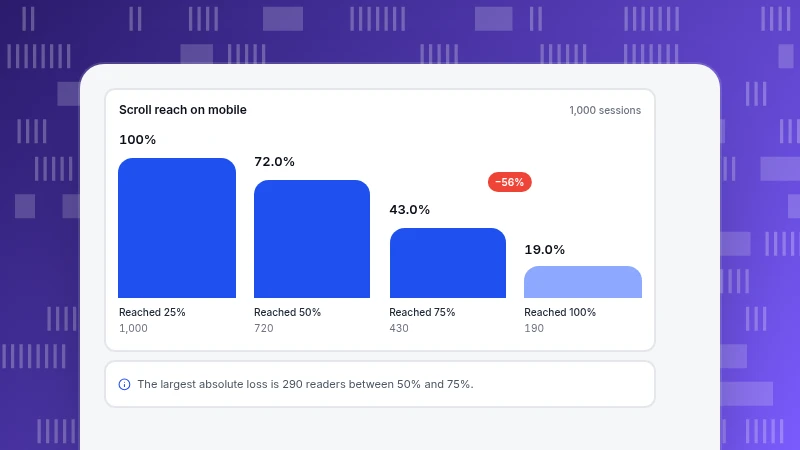
Mobile Content Marketing: How to Measure Load, Reading and Return
Mobile content marketing is measured in three layers: load, read and return. See Core Web Vitals thresholds, a recomputed 75th-percentile example, a scroll funnel and a mobile versus desktop comparison.
Read more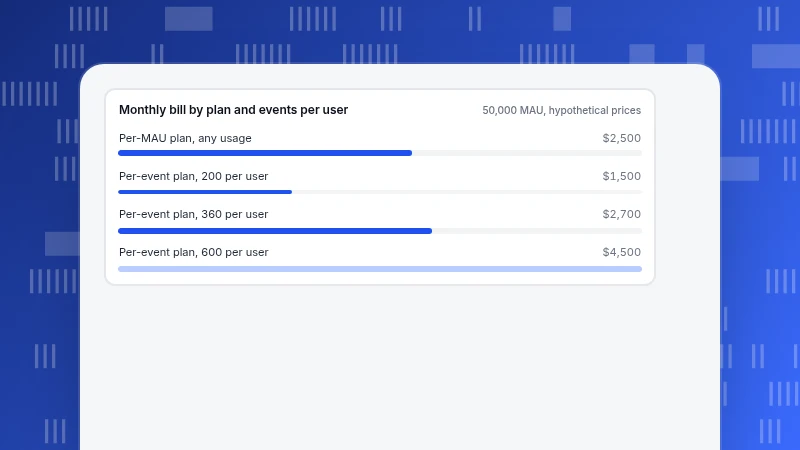
App Analytics Tools: How to Choose on Four Points, Not Feature Lists
How to choose app analytics tools: compare collection, attribution, privacy and cost. Includes a pricing break-even example, a seven-step test before you commit and a migration plan, without naming vendors.
Read more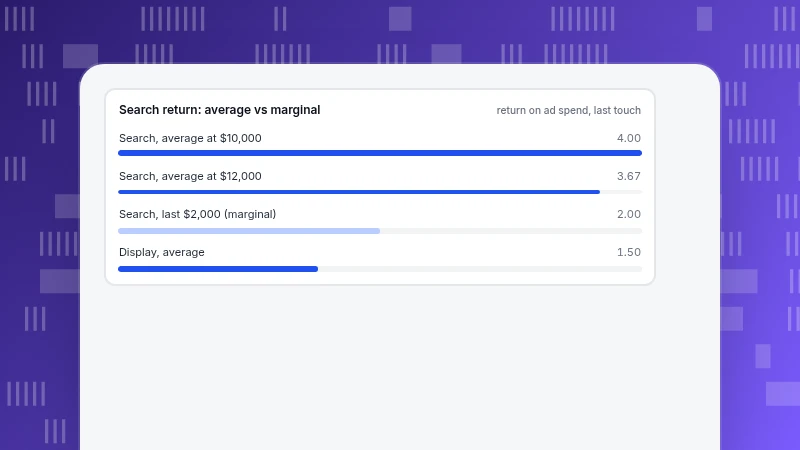
Marketing Optimization: How to Move Budget From Weak Channels to Strong Ones
Marketing optimization means moving budget to the channels that return more, once your measurement is stable. See a recomputed four-channel example, marginal versus average return and rules for how much to move.
Read more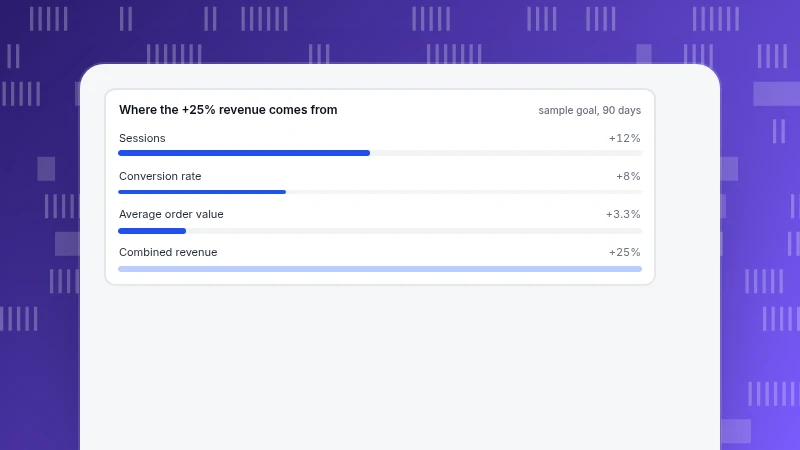
Marketing Goals: How to Set Ones You Can Measure and Reach
A marketing goal is a business result with a number and a date. See how to split a revenue goal across sessions, conversion and order value, assign channels, set checkpoints and read a missed one.
Read more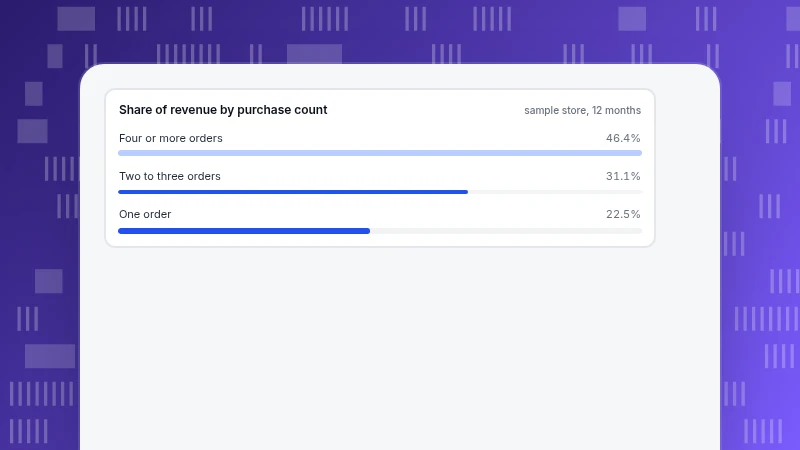
Market Segmentation Examples: Four Bases With Numbers You Can Check
Market segmentation examples for the four bases: demographic, geographic, behavioral and psychographic. See what a behavioral split looks like in order data and how to test whether a segment is real.
Read more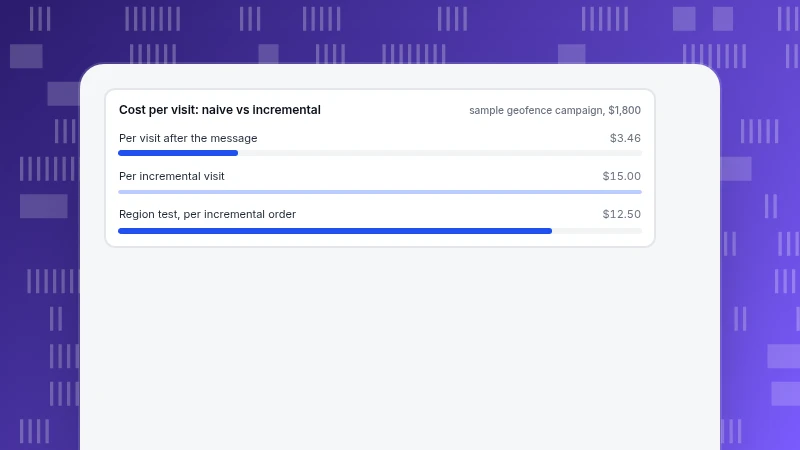
Location-Based Marketing: Consent First, Then Measure Visits and Lift
Location-based marketing works best when consent comes before targeting and results are measured against a holdout. See the types, how precise each source is, a recomputed geofence example and a region-level test.
Read more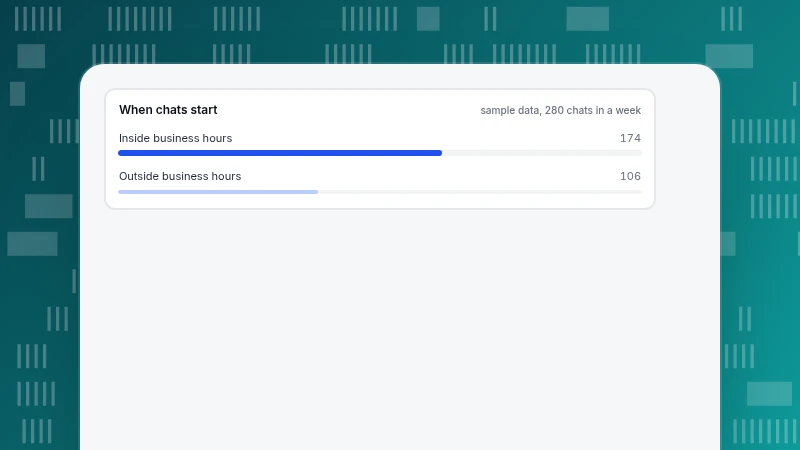
Best Live Chat for Small Business: Four Things to Check Before You Choose
The best live chat for a small business depends on four checks: response when nobody is at a desk, visitor languages, what AI may answer, and cost at your team size. Worked examples for coverage, pricing and a weighted scorecard, with no product ranking.
Read more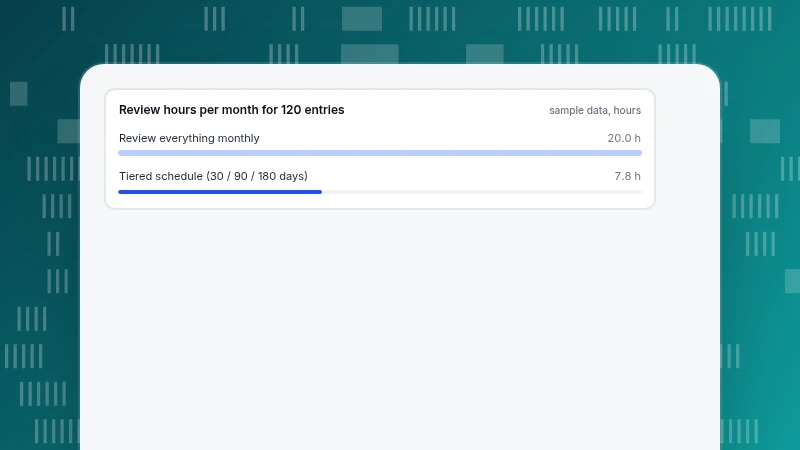
Knowledge Management Solutions: How to Keep Answers Accurate After Launch
Knowledge management solutions store answers, but the process decides whether they stay true. Who owns each entry, how often to review it, which metrics to watch, and a worked example of the review hours a 120-entry knowledge base needs.
Read more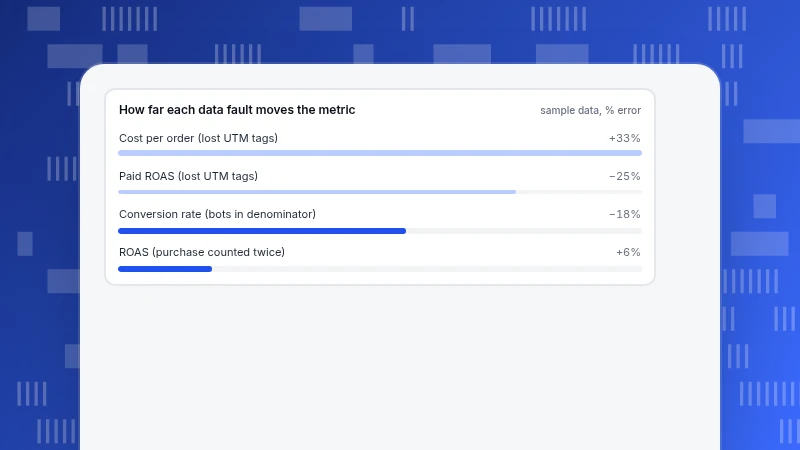
Impact of Poor Data Quality: Decisions, Cost and Trust, With a Worked Example
The impact of poor data quality lands in three places: decisions, cost and trust. Three sample data faults show how a bot-inflated denominator, a double-counted purchase and lost UTM tags turn into wrong decisions with money attached.
Read more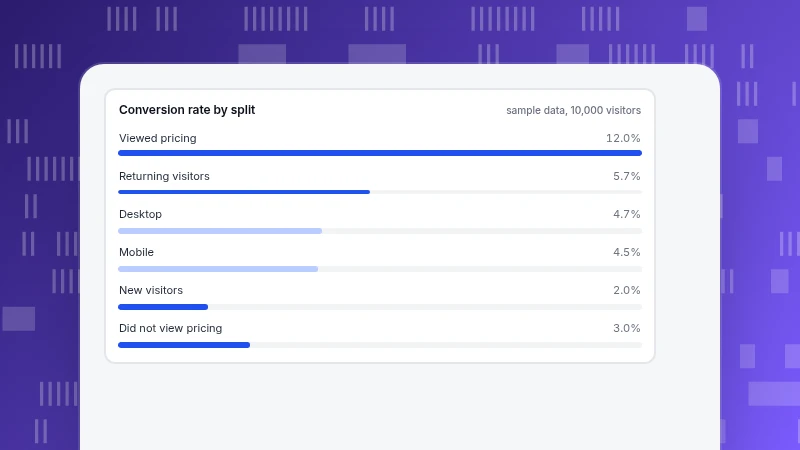
How to Segment Your Audience: Pick One Dimension, Then Prove It Matters
How to segment your audience: choose one dimension you can act on, define the rule, and test that the groups really behave differently. A worked example splits 10,000 visitors four ways and shows which two splits are worth keeping.
Read moreFive categories, one question each
Each category answers a recurring question we hear from customers. Start with the one closest to your job.
Analytics
Definitions, funnels, retention and the data-quality questions behind every number.
304 articlesGrowth & Marketing
Acquisition, marketing, site and app operations, and how to pick the one stage worth fixing first.
238 articlesLive Chat
Proactive invites, translation and turning support conversations into conversions.
78 articlesAI Search
GPTBot, ClaudeBot, PerplexityBot: who fetches your pages, what the files say and what comes back.
39 articlesProduct News
What shipped, why we built it that way, and how to turn it on.
64 articles