Try it on your own data
Every report in this article is in the free plan. One snippet for web and apps, up to 10 sites.
Start freeThe benefits of live chat are faster first responses, fewer lost sales when a question is answered on the page, a lower cost per contact because agents can hold several conversations, coverage outside office hours, and a stream of real customer questions. Each one is measurable with one metric. The trap is the conversion benefit: in the sample below, a raw 133% lift fell to 40% against a fair baseline. Below: each benefit, its formula and its data source.
What you will learn
- Pair every benefit with one metric, one formula and one data source before presenting it
- Use the median for response time and a matched baseline for conversion; the sample raw lift of 133% fell to 40%
- Say whether a cost saving is cash or capacity: faster handling is only cash if hours or headcount change
Which benefits of live chat can you actually measure?
Most lists of live chat benefits stop at adjectives: faster, friendlier, more convenient. A benefit you cannot measure cannot be defended in a budget meeting, and a benefit you measure badly gets blamed when the number moves for other reasons. The rule for this page: every benefit is paired with one metric, one formula and one place the number comes from.
| Benefit | Metric | Formula | Where it comes from |
|---|---|---|---|
| Faster answers | Median first response | Seconds from chat start to the agent's first reply, median | Chat report |
| Fewer lost sales from unanswered questions | Chatted vs matched not-chatted conversion | Chatted rate ÷ comparison rate − 1 | Chat report plus your analytics |
| More conversions | Incremental conversions | Chatters × (chatted rate − matched rate) | Same, with a fair baseline |
| Lower cost per contact | Cost per resolved conversation | Loaded agent cost per hour ÷ conversations resolved per hour | Your payroll and the chat report |
| Coverage outside office hours | Offline messages answered | Messages left ÷ messages replied | Offline message list |
| Customer insight | Questions the knowledge base could not answer | Handoffs by reason | Chat inbox and knowledge base |
| Satisfaction | Average score | Mean of 1 to 5 scores after resolution | Chat report |
The sections below take the benefits in the order of the table, with numbers you can recompute. For whether chat raises conversion at all, with the research, see does live chat increase conversions; this page is about how to measure each benefit once you have chat. For the broader service picture, see live chat customer service.
| Benefit | Metric | Where it comes from |
|---|---|---|
| Faster answers | Median first response | Chat report |
| Fewer lost sales | Chatted vs matched not-chatted conversion | Chat report plus analytics |
| Lower cost per contact | Cost per resolved conversation | Payroll and chat report |
| After-hours coverage | Offline messages answered | Offline message list |
| Customer insight | Unanswered questions by page | Inbox and knowledge base |
| Satisfaction | Average 1 to 5 score | Chat report |
Each benefit needs one metric and one data source before it goes in a budget case.
How do you measure faster answers?
The metric is first response time: how long a visitor waits for the first human reply. Measure it with the median as well as the average, because one slow outlier ruins the average.
Sample data: ten conversations, first response in seconds: 12, 15, 18, 20, 22, 25, 30, 40, 95, 300. The sum is 577, so the average is 577 ÷ 10 = 57.7 seconds. The median is the middle of the sorted list, (22 + 25) ÷ 2 = 23.5 seconds. Describing the service as "58 seconds" overstates the typical wait; the honest summary is "typically 24 seconds, with one conversation at 5 minutes".
Two practical points:
- Report the long tail separately. Count conversations over a target, for example 60 seconds: 2 of 10 here (95 and 300).
- Know what the number excludes. If an AI assistant answers first, a human first-response metric should not include that reply, or it will flatter you. The sample is a human-only measurement.
Does live chat reduce abandoned purchases?
Shoppers abandon for reasons that a quick answer can sometimes address. Baymard Institute's compilation puts the average cart abandonment rate at 70.22%, the unweighted mean of 50 studies, with documented rates from 55% to 84%. Among the reasons given by US online shoppers who abandoned, Baymard lists extra costs being too high (40%), delivery being too slow (20%), the site wanting them to create an account (18%), an unsatisfactory returns policy (13%), and not being able to see the total order cost up front (12%) (Baymard Institute). The listed percentages add up to more than 100%, so they are not shares of one total and should not be summed.
Chat cannot make shipping cheaper. It can explain the total before the checkout page surprises someone, confirm a delivery date and state the returns rule in one sentence. So the measurable benefit is not "chat reduces abandonment" in general, but "people who asked a question on a delivery or checkout page completed more often than comparable people who did not ask."
How to measure it: look at the pages where chats start (the "hot pages"), then compare the goal rate of visitors who chatted with comparable visitors who did not, as in the next section. If chats cluster on shipping and returns pages, the content of those pages is also an answer: fix the page and the chat volume on it should drop.
Does live chat increase conversion, and how much?
There is evidence, with caveats. A study of a large online marketplace (Sun, Chen and Fan, Production and Operations Management, 2021) found that live chat has a positive effect on traffic-to-sales conversion, and that the effect is stronger when product information on the page is less comprehensive and when the product's perceived value is higher (Sun, Chen and Fan). The study uses observational data, which is the clue to the main trap: people who start a chat are different from people who do not.
Sample data, one month on a store with a 40% gross margin and a $60 average order:
- 50,000 visitors; 1,500 chatted, 48,500 did not.
- 105 of the chatters reached the purchase goal: 105 ÷ 1,500 = 7.0%.
- 1,455 of the others did: 1,455 ÷ 48,500 = 3.0%.
- Relative lift: 7.0% ÷ 3.0% − 1 = 133%.
That 133% is the raw gap. It credits chat with everything that differs between the two groups, such as the fact that chatters were already on product or checkout pages. Suppose you compare chatters with visitors who viewed the same pages and did not chat, and that group converted at 5.0%. Then:
| Version | Baseline rate | Extra conversions | Margin at $24 each | After a $500 monthly chat cost |
|---|---|---|---|---|
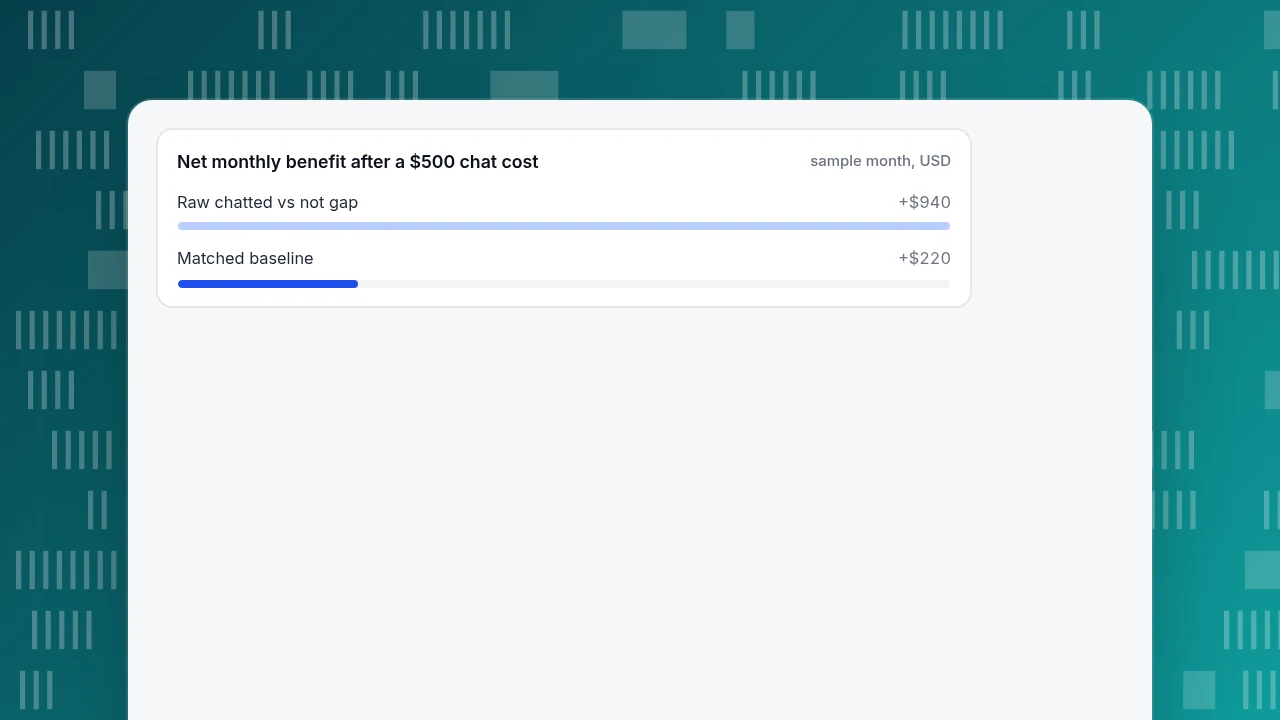
| Raw gap | 3.0% | 1,500 × (7.0% − 3.0%) = 60 | $1,440 | +$940 |
| Matched | 5.0% | 1,500 × (7.0% − 5.0%) = 30 | $720 | +$220 |
The matched version halves the benefit, from 60 to 30 conversions, and the lift drops from 133% to 7.0% ÷ 5.0% − 1 = 40%. The decision still holds, because $720 is more than $500, but a team that had promised the raw $1,440 would be wrong by half. Present the raw number as an upper bound and the matched number as the estimate.
Sample size matters too: with 1,500 chatters, one more conversion changes the chatted rate by 1 ÷ 1,500 = 0.07 percentage points, which is small; with 40 chatters it would be 2.5 points. Wait for several hundred chatters before trusting a daily comparison.
Net monthly benefit after a $500 chat cost
sample month, USDHow much does live chat lower the cost per contact?
Chat lets one agent hold more than one conversation at a time, which a phone call does not. The benefit shows up as cost per resolved conversation.
Sample data: a fully loaded agent costs $28 an hour. On the phone an agent resolves 5 contacts an hour: $28 ÷ 5 = $5.60 each. In chat, with two conversations open at once, assume throughput rises by a factor of 1.6 rather than 2.0 because of switching between them: 5 × 1.6 = 8 conversations an hour, so $28 ÷ 8 = $3.50 each, 37.5% lower. The 1.6 is an assumption; measure your own by dividing resolved conversations per hour at concurrency 1 and at concurrency 2.
Do not turn that saving into a promise. If the same people end up handling more volume rather than fewer hours, the saving is capacity, not cash. And a separate source of efficiency is AI assistance: in a staggered rollout to 5,179 support agents, access to a generative AI assistant raised issues resolved per hour by 14% on average and 34% for novice workers (Brynjolfsson, Li and Raymond, NBER Working Paper 31161). That is a different mechanism from concurrency, and the two should not be multiplied together without measuring.
What else does chat give you?
- Coverage outside office hours. When nobody is online, visitors can leave an email and question. The benefit is the count of messages answered next morning; track it as messages left ÷ messages replied.
- Customer insight. Every question is a signal about what the page, price or policy failed to say. The useful output is a ranked list of unanswered questions by page, which becomes a to-do list for content.
- Satisfaction. Ask for a 1 to 5 score after resolution and track the average and the share of low scores. We did not find an independent figure we can quote for how chat compares with other channels, so measure your own rather than borrowing a vendor's claim.
When will chat's benefits not show up?
- Low traffic. With a few dozen chatters a month, rates swing by several points. Aggregate over longer periods.
- Nobody answers. A visible chat bubble with a 5-minute reply is worse than none. If staffing cannot match hours, say so on the widget and use offline messages.
- Wrong pages. Chat on a page where visitors rarely have questions gives little to measure.
- Comparing with the wrong baseline. As the example showed, the raw gap overstates.
How to measure live chat benefits in TapCub
If the store in the example ran TapCub live chat, this is where each number would come from. Chat and analytics use the same script and the same visitor ID, so no second tool is needed.
- Switch it on. On a site that already has the TapCub script, turn on the live chat switch in Live chat › Chat settings › Appearance; no change to your site code is needed. Set the working hours in Live chat › Chat settings › Office hours.
- Read response and workload. Live chat › Reports shows conversations, resolution rate, average first response (a median is shown too), satisfaction (1 to 5, within 24 hours after resolve) and knowledge base hit rate. First response counts human replies only; an AI reply is not included.
- Find where questions start. The same page has a heatmap of chat starts by weekday and hour, and a list of the top 10 hot pages, the pages where the visitor started the chat, without the query string.
- Compare chatted with not chatted. Live chat › Reports › Conversion attribution shows, per day, the goal rate of visitors who chatted and of visitors who browsed without chatting, plus the relative lift (chatted rate ÷ no-chat rate − 1), and warns when fewer than 30 visitors chatted. That is the raw gap in the example. The matched baseline you build yourself, for instance from visitors to the same pages.
- Follow up what chat could not answer. Offline messages are listed with statuses New, Replied and Closed in Live chat › Chat settings › Offline messages, and the knowledge base's draft inbox can turn resolved conversations into draft answers.
TapCub does not run randomised holdouts, and there is no pre-chat form on the widget: ask for an email in the conversation, or use offline messages.
FAQ
What are the benefits of live chat?
Faster first responses, fewer lost sales when a question gets answered on the page, lower cost per contact because agents can hold more than one conversation, coverage outside office hours through offline messages, and a stream of real customer questions. Each is measurable with one metric: median first response, matched conversion, cost per resolved conversation, messages answered, unanswered questions.
Does live chat increase sales?
Research on a large marketplace found a positive effect on conversion, stronger when product information was thin. But raw comparisons overstate it, because people who start a chat are already closer to buying. In the sample here, a 133% raw lift fell to 40% against a matched baseline, still enough to cover a $500 monthly cost.
How do you measure the ROI of live chat?
Add the margin from extra conversions measured against a fair baseline, add any cost savings you can defend, and divide the net by the cost. In the sample, 30 extra conversions at $24 margin gave $720 against a $500 cost, a net of $220. Treat the raw chatted-versus-not gap as an upper bound.
Is live chat cheaper than phone support?
It can be, if agents handle concurrent conversations. In the sample, a $28 hourly cost and 5 phone contacts an hour gave $5.60 each; at 8 chats an hour it was $3.50. Measure your own concurrency effect, and note that a lower cost per contact is capacity unless hours or headcount actually change.
How many chats do you need before trusting the numbers?
Several hundred chatters for conversion comparisons. With 1,500 chatters, one conversion moves the rate by 0.07 percentage points; with 40 chatters, by 2.5 points. TapCub warns when fewer than 30 visitors chatted on a day, so aggregate several days before comparing.
Sources
- Haoyan Sun, Jianqing Chen and Ming Fan. Effect of Live Chat on Traffic-to-Sales Conversion: Evidence from an Online Marketplace. Production and Operations Management 30(5), 2021 — positive conversion effect, stronger when product information is less comprehensive. Checked 2026-11-20.
- Baymard Institute. Cart abandonment rate statistics — 70.22% average across 50 studies and the reasons for abandonment. Checked 2026-11-20.
- Erik Brynjolfsson, Danielle Li and Lindsey R. Raymond. Generative AI at Work. NBER Working Paper 31161 — 5,179 agents, 14% average and 34% novice gains. Checked 2026-11-20.
Was this article helpful?
We use your answers to fix and expand this page.
Couldn’t send. Please try again in a minute.
Thanks for the feedback. We’ll use it to improve this page.You’ve already sent feedback on this page. Thanks.

Product Analyst
Focuses on event analysis, conversion funnels, and retention, using clear metric definitions and structured analysis to explain product performance.