Blog Analytics, growth and chat, explained with real numbers · Page 9
Practical notes from the team building TapCub: how metrics are defined, where funnels break, what AI crawlers take from your site, and how support teams turn conversations into conversions.
Browse every article
Filter by category or search a keyword. Every article links to the report or setting it talks about.
723 articles · page 9 of 16
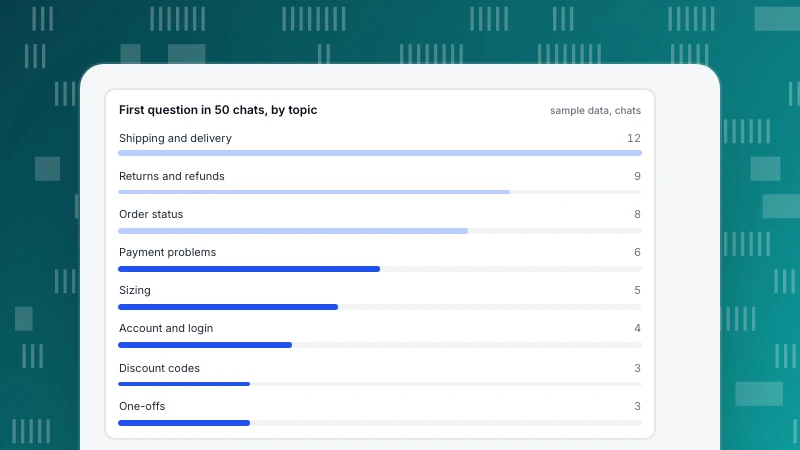
FAQ Site: How to Build an FAQ Page From Real Customer Questions
How to build an FAQ site that works: take questions from real conversations, sort 50 chats into entries with a counting rule, write answers that settle the question in one sentence and check whether repeat questions fall.
Read more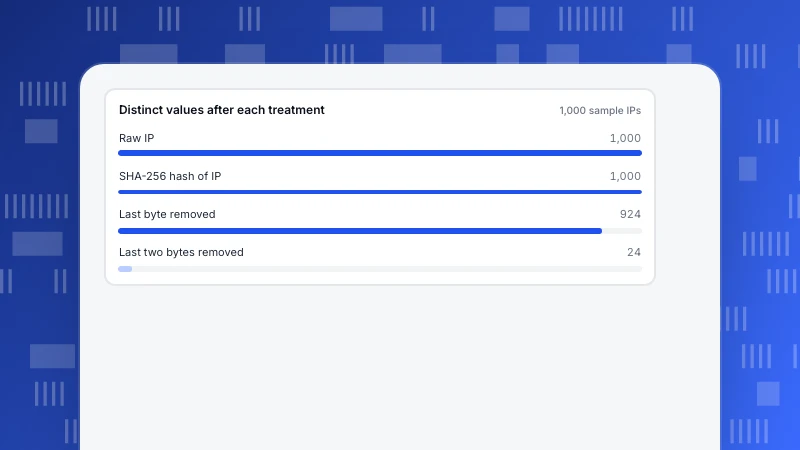
Data protection technology: the five types and how to choose
Data protection technology falls into five types: encryption, access control, masking, minimization and traceability. What each stops and does not stop, a worked hashing and truncation example, and how to choose from the threat.
Read more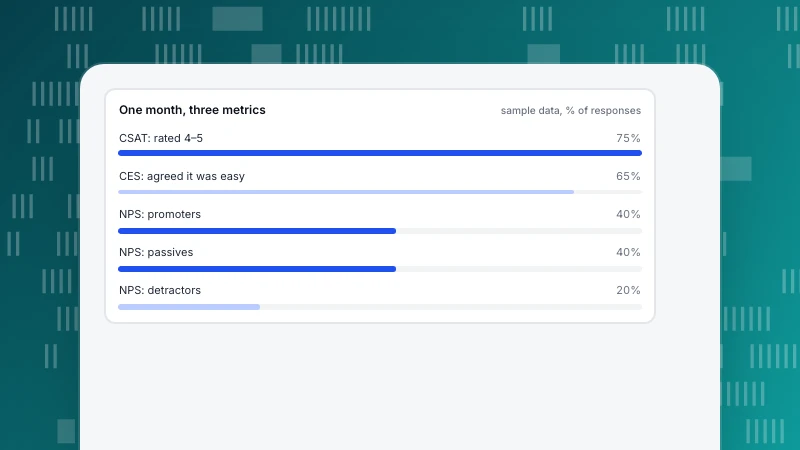
Customer Satisfaction Tools: What They Measure and When to Ask
What customer satisfaction tools do, how CSAT, NPS and CES differ, when to ask each, a worked example where the three metrics tell different stories, and how to choose a tool without starting from a product list.
Read more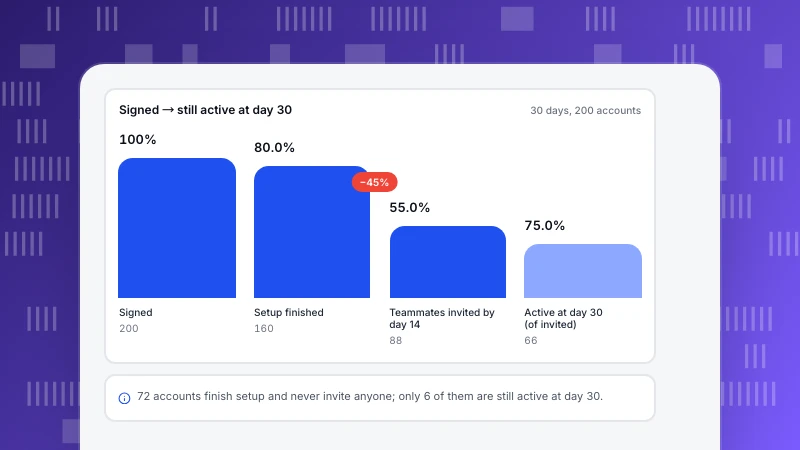
Customer onboarding system: guidance, data and people, and how to measure it
A customer onboarding system has three blocks: guidance, data and people. How to choose milestones, test them on an account funnel, report time to value as a median and decide when a person should step in.
Read more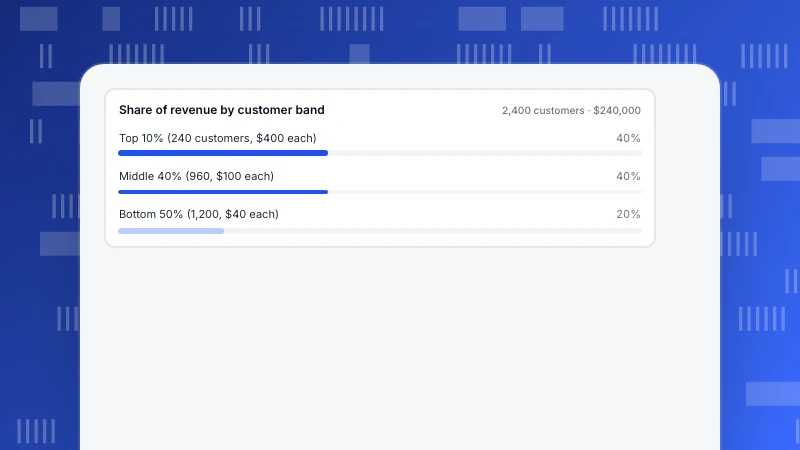
Customer analysis: start with one of four questions, not a report
Customer analysis answers one of four questions: who comes, who stays, who spends, who leaves. A five-step first pass with a recomputable example for all four and a sized decision at the end.
Read more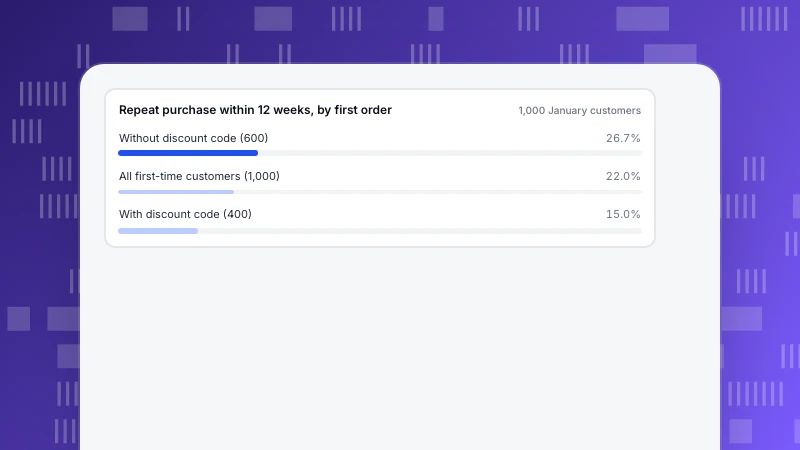
Consumer behavior examples: eight behaviors and the trace each leaves in your data
Eight consumer behavior examples, from comparison shopping to repeat purchase, with the signal each leaves in analytics, two worked examples you can recompute and rules for checking a pattern is real.
Read more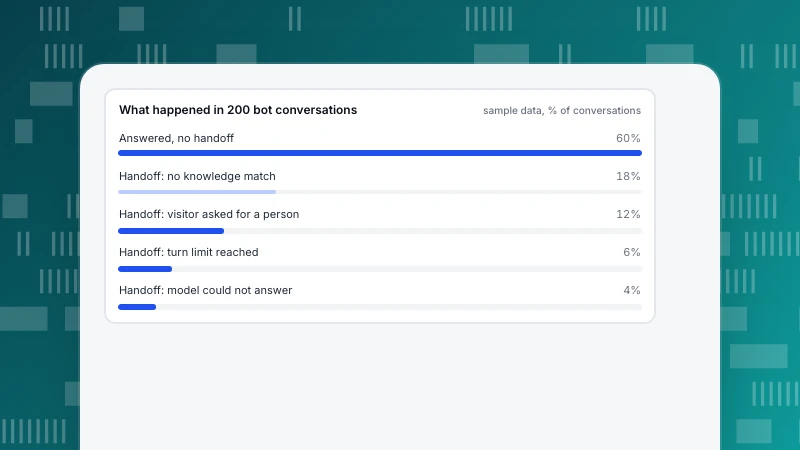
Chatbot Templates: 8 Conversation Scripts and How to Adapt Them
Eight chatbot templates you can adapt: greeting, topic menu, answer and check, clarifying question, handoff, offline hours, a pointer for what the bot can't do and a close. Plus how to change them using handoff data.
Read more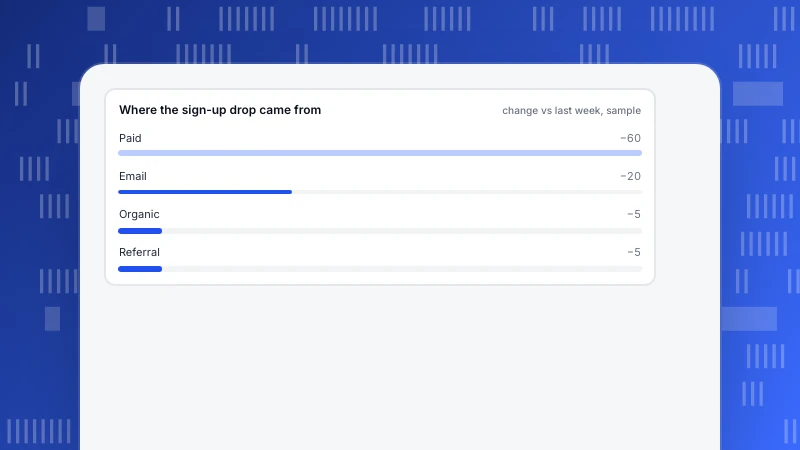
Business intelligence vs data analytics: which to start with
Business intelligence tells you what happened; data analytics asks why and what next. A comparison, five questions to decide, a sign-up drop worked both ways and the smallest setup for a small team.
Read more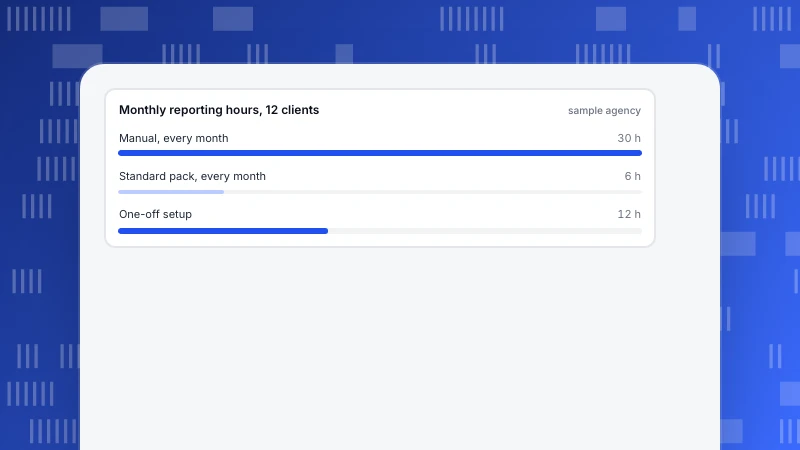
Analytics for Agencies: Structure Multi-Client Reporting That Scales
Agency analytics is less about charts than structure: separate data per client, shared metric definitions, a delivery rhythm and controlled access. Includes a metric dictionary, a time calculation for 12 clients and a permissions table.
Read more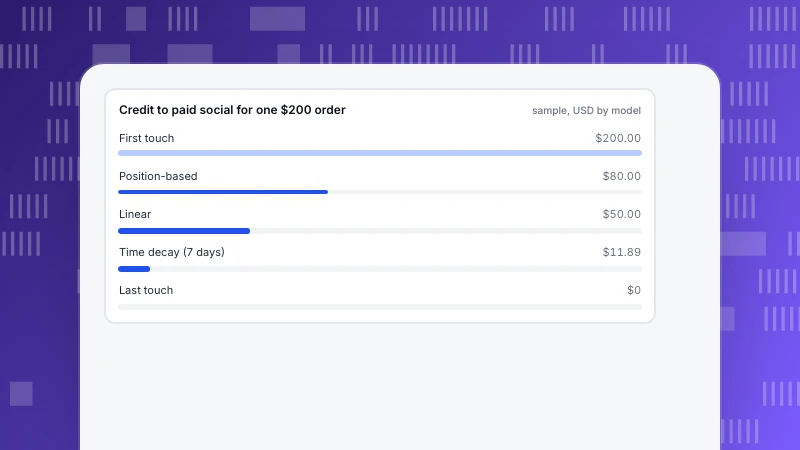
What Is Attribution? Models, a Worked Example and How to Choose
Attribution decides which touchpoint gets credit for a conversion. The five common models, one four-touch order scored under all of them, and how to choose a model for your decision.
Read more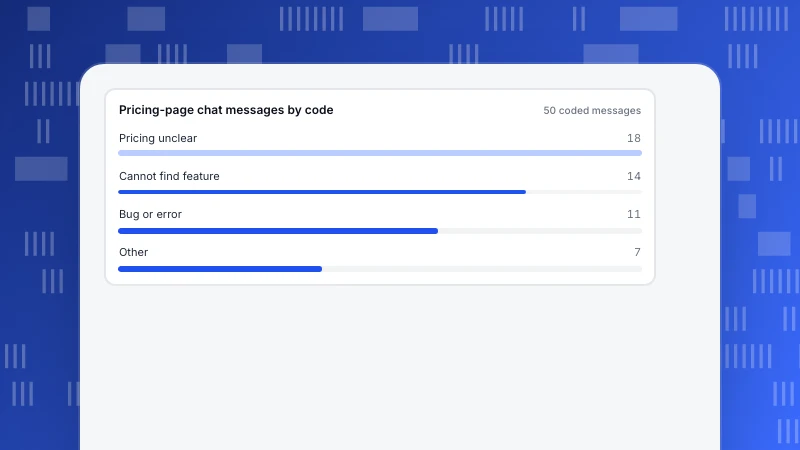
Qualitative Data Examples: 10 Sources and How to Code Them
Qualitative data is descriptive: words, categories and observations. Ten examples from product and support work, a worked coding example with counts, a reliability check, and how to pair it with funnel numbers.
Read more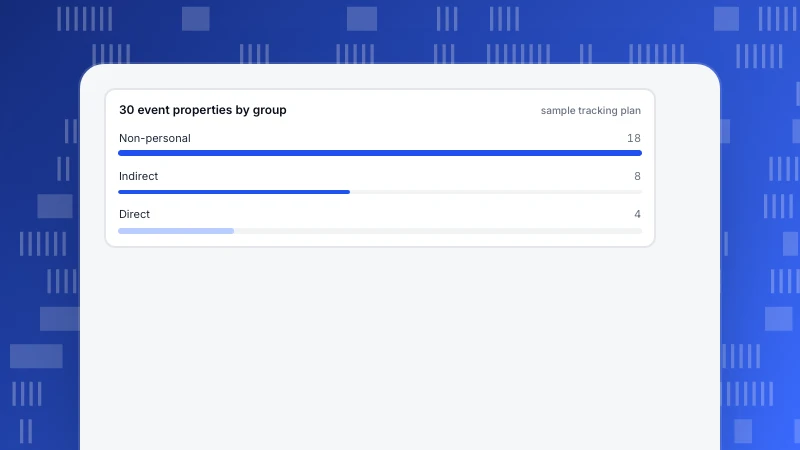
PII Examples: 20 Fields in Three Groups and What to Do With Each
Twenty concrete PII examples in three groups (direct, indirect, sensitive), which ones sneak into analytics data, a 30-property audit and a handling rule for each. Not legal advice.
Read more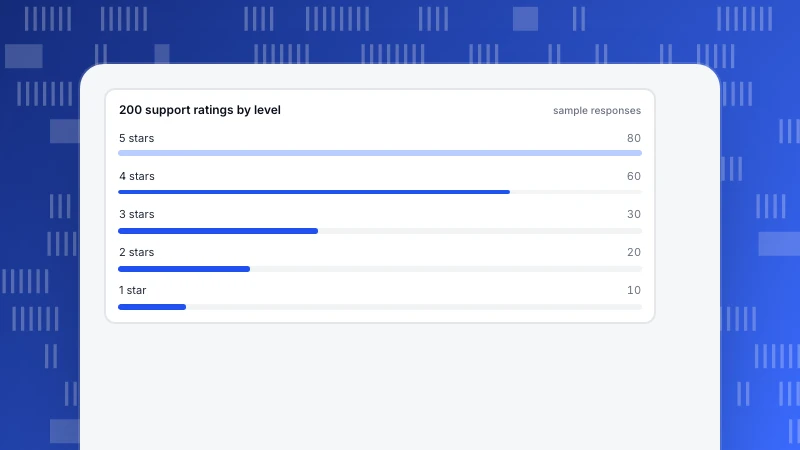
What Is Ordinal Data? 8 Examples and Which Statistic to Use
Ordinal data has an order but no known gaps. Eight product and support examples, a 200-rating worked example where the mean flips under a harmless recode while the median holds, and how to chart and report it.
Read more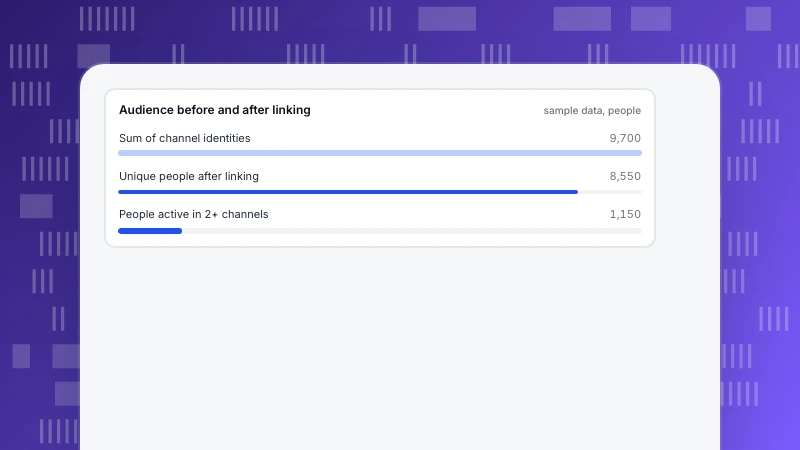
Omnichannel Engagement: What It Is and How to Measure It
Omnichannel engagement means each interaction continues from the last across web, app and chat. Multichannel vs omnichannel, three metrics, a worked example you can recompute and how to connect identity.
Read more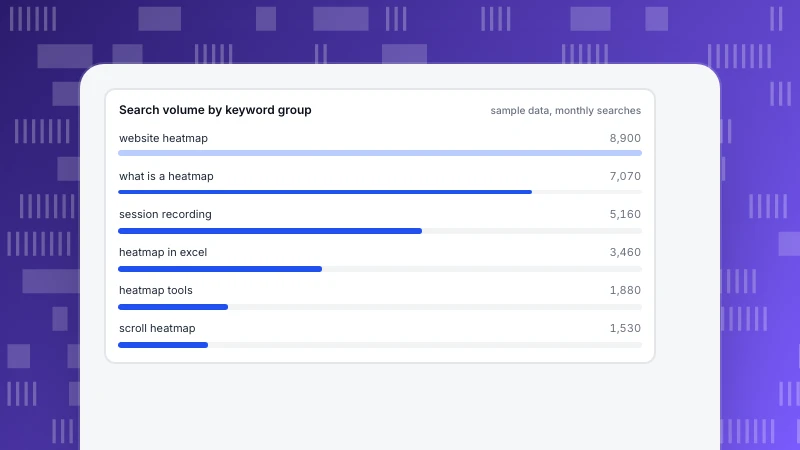
Keyword Grouping: How to Group Keywords by Search Intent
Keyword grouping sorts search terms into sets that one page can serve. Why intent beats wording, three methods, four steps and a 20-term example grouped by SERP overlap that you can recompute.
Read more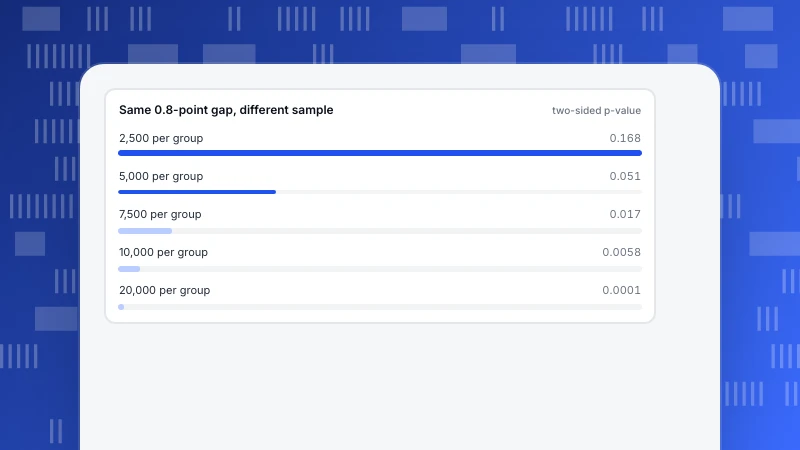
P-value meaning: how to interpret a p-value, with a worked example
A p-value is how often random variation alone would produce a gap as large as yours if there were no real difference. A 4.0% vs 4.8% worked example shows p = 0.168, why it does not mean 17% chance of no effect, and what to read next to it.
Read more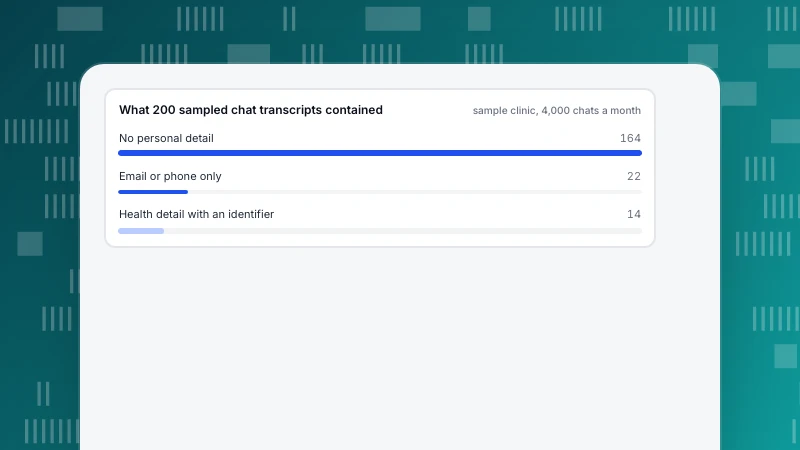
HIPAA Compliant Chatbot: What to Check Before You Deploy One
No chatbot is compliant on its own. Learn the two questions to ask first (does PHI reach it, is the vendor a business associate), a six-layer vendor review, a transcript audit and a decision table. Not legal advice.
Read more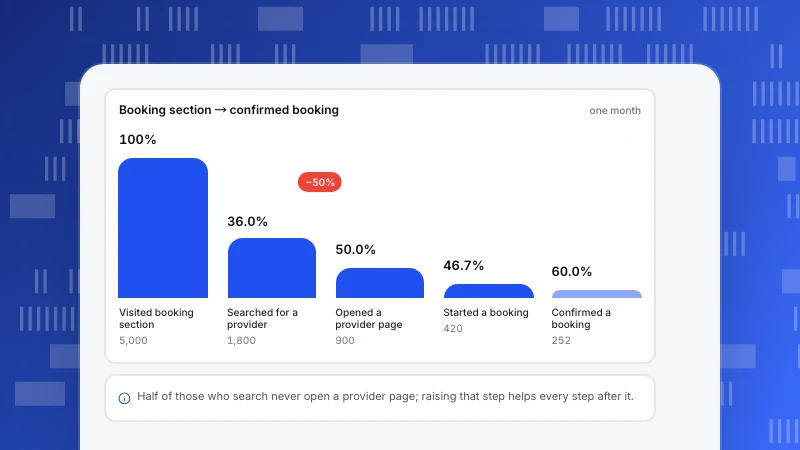
Healthcare Analytics for Websites and Apps: Four Layers, Eight Metrics
Healthcare analytics has a clinical side and an operational side. This guide covers the operational one: four analytics layers, eight metrics for a provider's site and app, a booking-funnel example and the privacy line not to cross.
Read more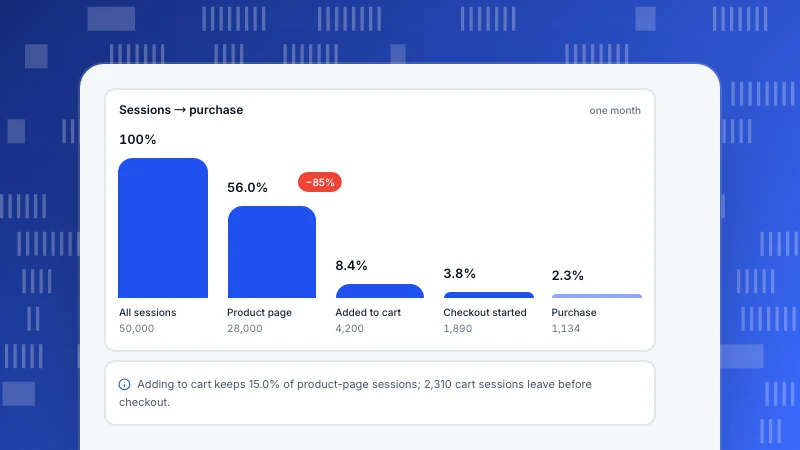
Ecommerce Analytics Tools: How to Choose by the Question You Need Answered
Ecommerce analytics tools fall into five types by the question they answer: traffic, funnel, behaviour, ad return and repeat buying. Five criteria, worked funnel and channel examples and a minimal stack for a store.
Read more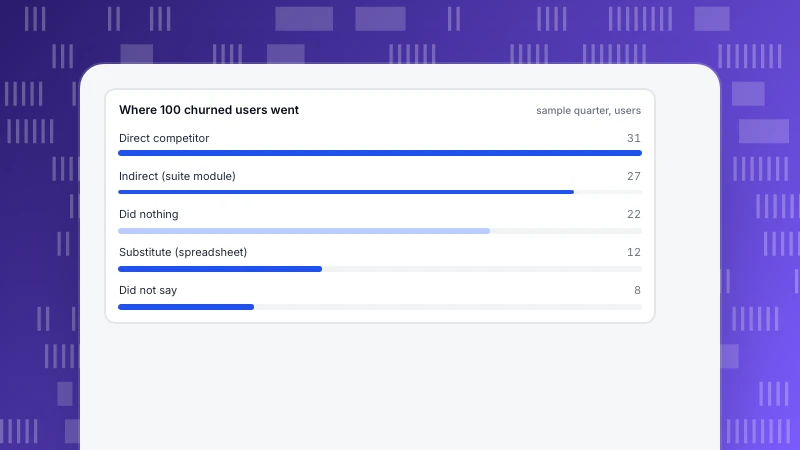
Direct vs Indirect Competition: How to Tell Them Apart and Find Yours
Direct competitors sell the same thing; indirect competitors solve the same problem differently. Definitions, four questions that find both, and a 100-churned-user example showing direct rivals explain only a third of departures.
Read more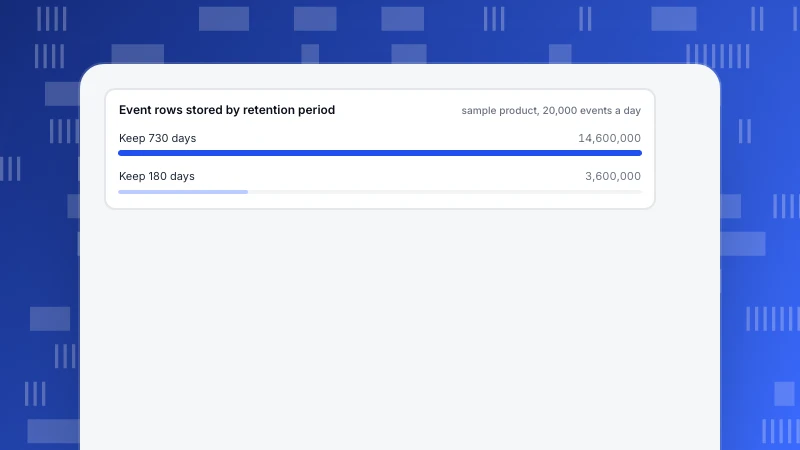
Data Protection Strategy: Six Blocks That Answer What, Who and How Long
A data protection strategy answers three questions for every dataset: what you hold, who can see it and how long you keep it. See six blocks with owners, a field-inventory example, a retention calculation and request and breach procedures.
Read more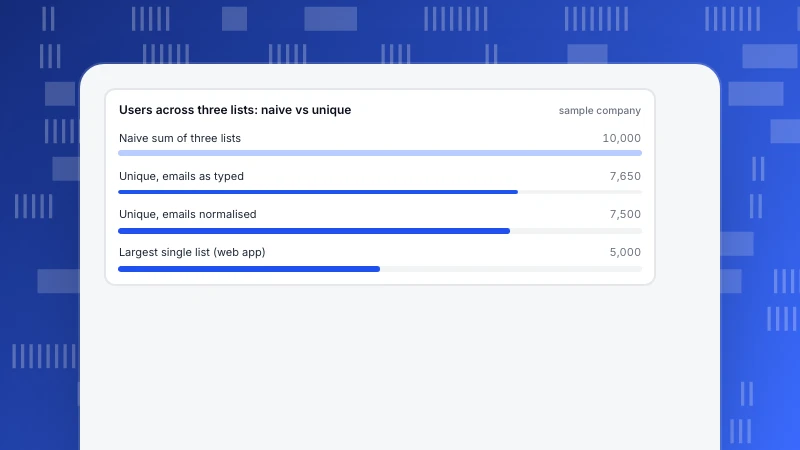
Unified Data: Four Approaches to Integration and How to Choose
Unified data means several sources read as one consistent set. Four integration approaches compared, five questions to choose between them and a worked example merging three user lists.
Read more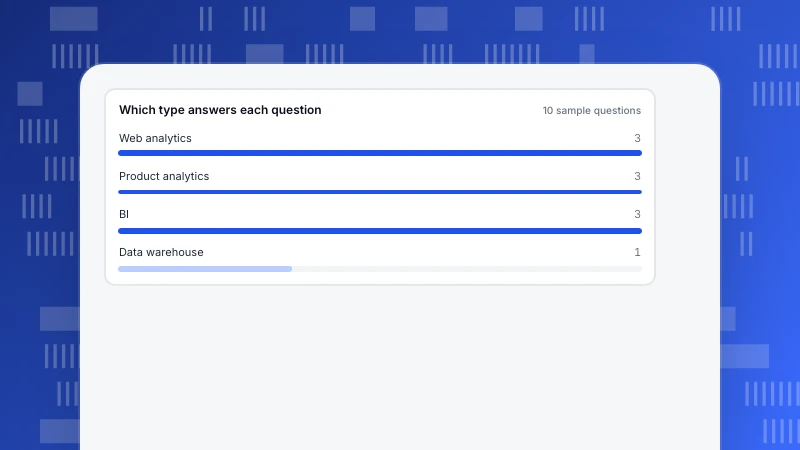
Data Analytics Platforms: Four Types and How to Choose
Data analytics platforms come in four types: web analytics, product analytics, BI and data warehouses. How to choose with six questions, a worked example, a decision table and the smallest stack that works.
Read more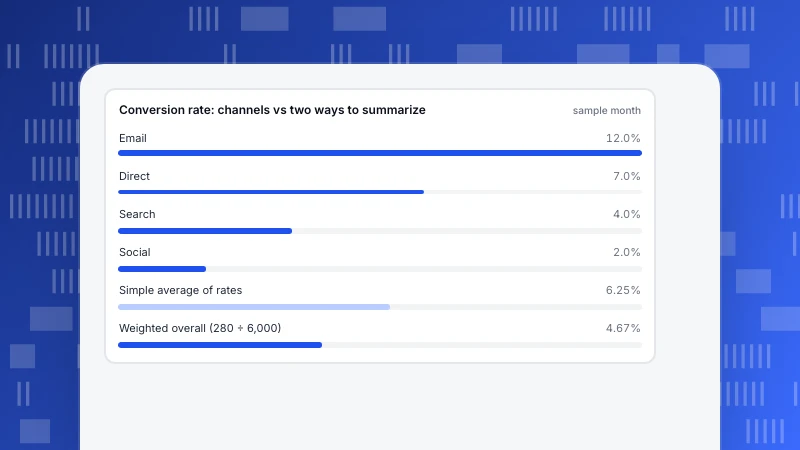
Aggregation Definition: What It Means and How It Misleads
To aggregate is to reduce many records to one value with a function such as a sum, average or count. What each function hides, and three traps: averaging ratios, Simpson's paradox and a grain that is too coarse.
Read more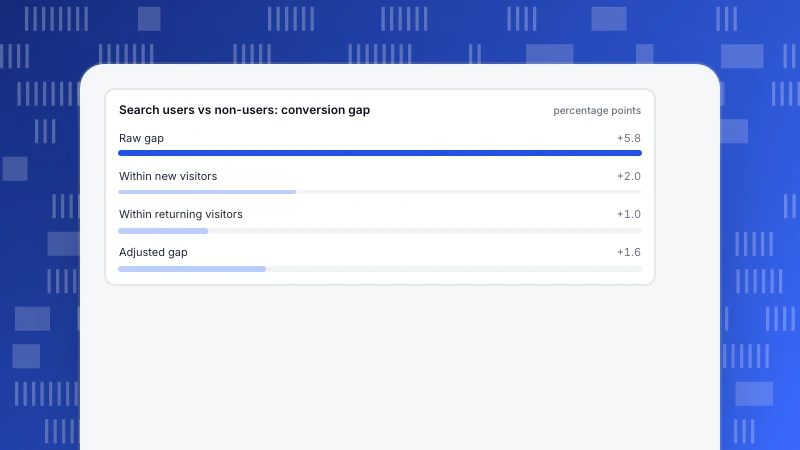
Correlation vs causation examples: 10 from product and marketing data
Ten correlation vs causation examples from product, marketing and support data, each with the likely third factor and how to test it, plus two worked examples: a 5.8-point conversion gap that shrinks to 1.6 points, and how often random metrics correlate.
Read more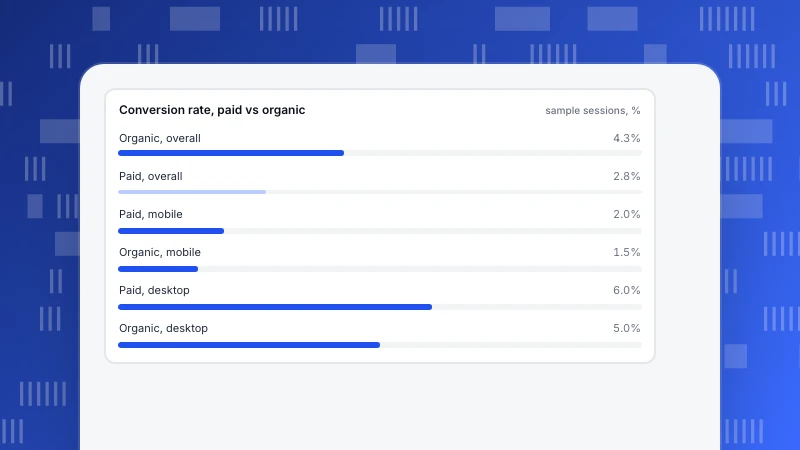
Confounding Variables: Examples and How to Spot Them in Your Data
Three recomputable examples of confounding variables from product and marketing data: a feature that seems to double retention, an email lift that mostly vanishes and a channel that wins on every device yet loses overall. Plus how to split, standardise and avoid common mistakes.
Read more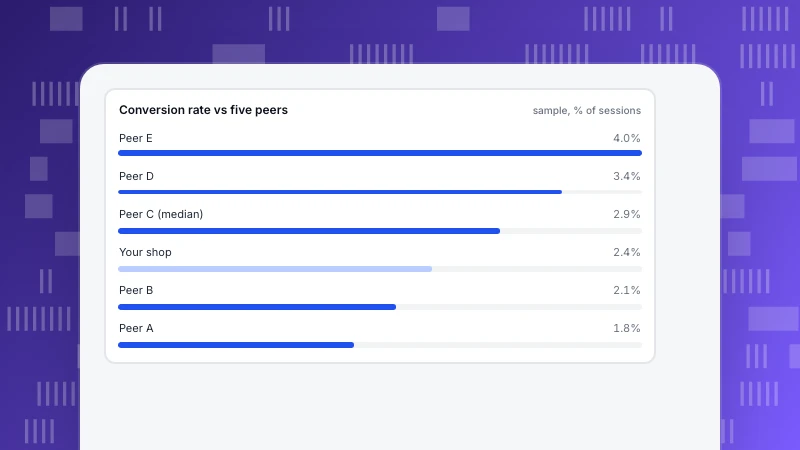
Competitor Benchmarking: How to Compare Fairly with Public Data
Competitor benchmarking finds which metrics are worth working on, using only public, comparable, same-definition data. Four steps, sources that qualify, and a worked example where a 17% gap vanishes after matching traffic mix.
Read more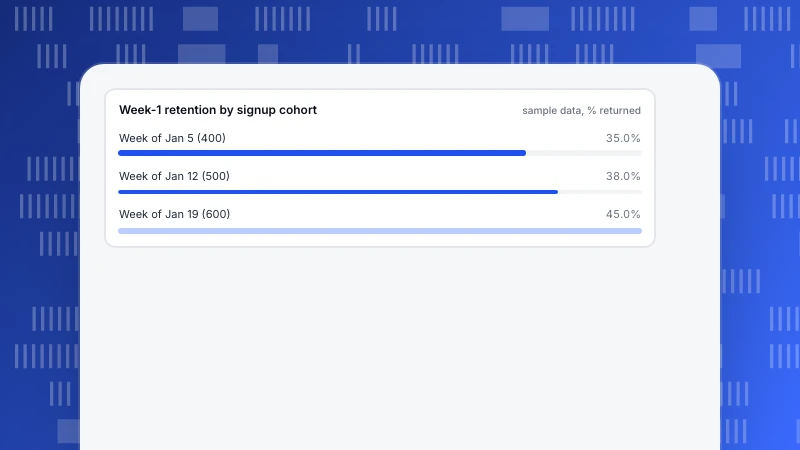
What Is a Cohort? Definition, Types and How to Read One
A cohort is a group of people who share the same starting point, such as everyone who signed up in one week. Time and behavior cohorts, three steps to define one, and a worked retention table you can recompute.
Read more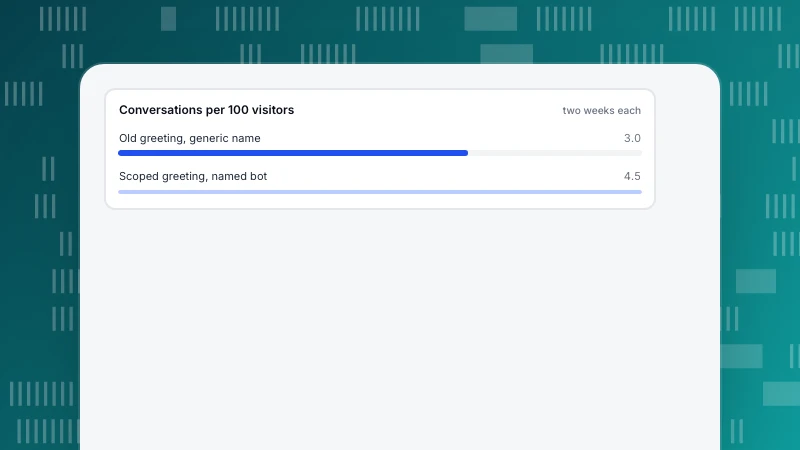
Bot Names: How to Name a Chatbot (30 Ideas and a Test)
How to choose a bot name that tells visitors it is a bot and what it does: five naming rules, whether to use a human name, 30 names by industry, an opening-line formula and a way to test the result.
Read more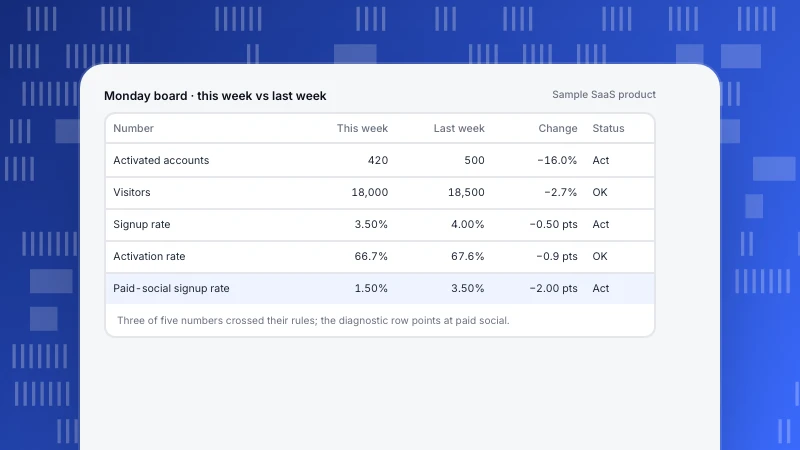
Business Dashboard: How to Build One Around a Decision, Not a Metric List
A business dashboard should serve one decision. Five design rules, a three-layer structure from north star to diagnostics, a layout with rules and owners, and a worked week that finds the cause in two minutes.
Read more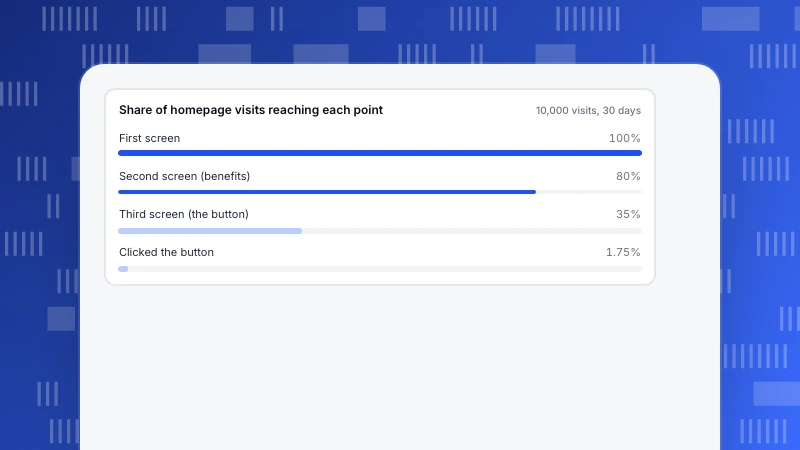
Best Homepage Design: There Is No Single Best, So Test Yours With Data
No homepage design is best for everyone. Six parts every homepage has, what data tests each one, and a worked example showing why a call to action in the third screen gets capped by scroll reach.
Read more
AI Visibility Audit: A Five-Step Checklist You Can Repeat
How to run an AI visibility audit as a checklist rather than a score: crawler access, llms.txt, crawler logs, what assistants cite and what the visits convert to, with worked examples and a full checklist table.
Read more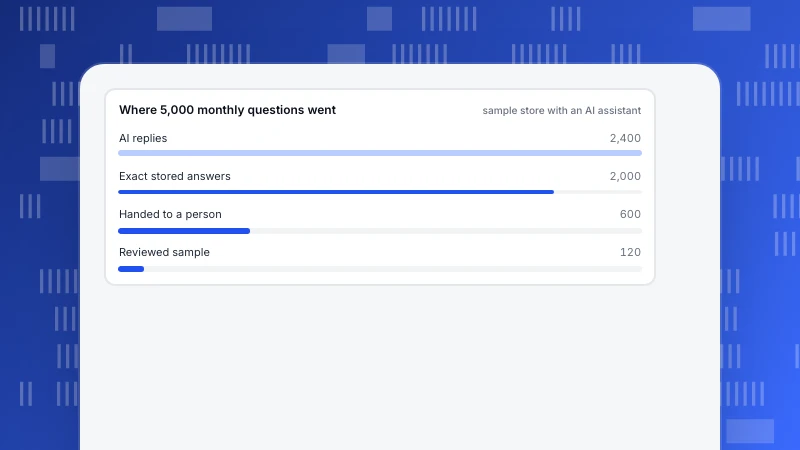
AI Data Governance: Five Controls, Inputs First and Outputs Second
AI data governance adds three questions to ordinary governance: what data reaches the model, whether outputs can be traced, and whether a person checks them. See five controls, a review-sampling example with numbers and what to write in your input rules.
Read more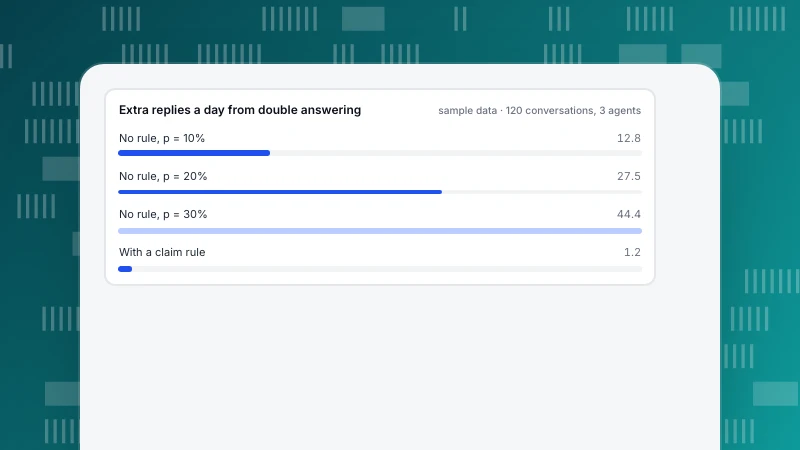
Shared Inbox: 5 Actions and 3 Rules to Stop Double Replies
A shared inbox is a team queue where every conversation shows an owner and a status. Learn the five actions, the three rules to write first, and what double replies cost a team of three.
Read more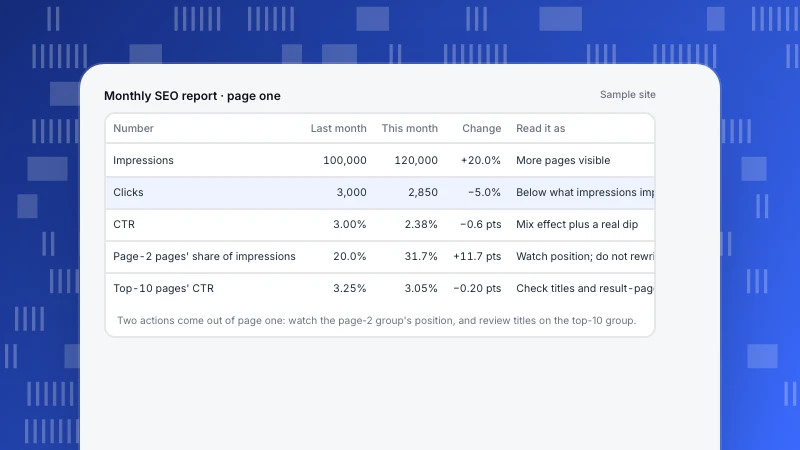
SEO analytics reporting: what to put in a monthly report so it leads to action
A good SEO report puts a decision after every number. The four-part structure, 6–8 metrics with definitions, how to read impressions up and clicks down, and how to write next month's actions.
Read more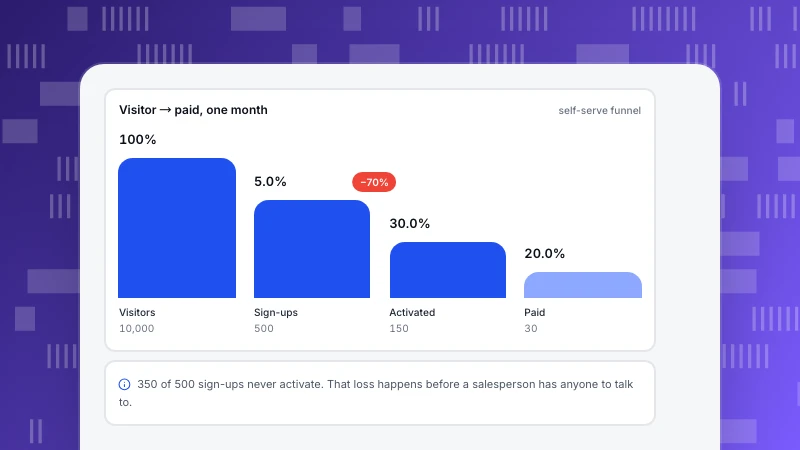
SaaS Sales Funnel: Put the Trial in the Middle and Read Each Stage
A SaaS sales funnel runs visitor, sign-up, activated, paid, with the trial in the middle. A worked 10,000 → 30 example, why one total conversion rate hides problems, how to define stages, and where self-serve hands off to sales.
Read more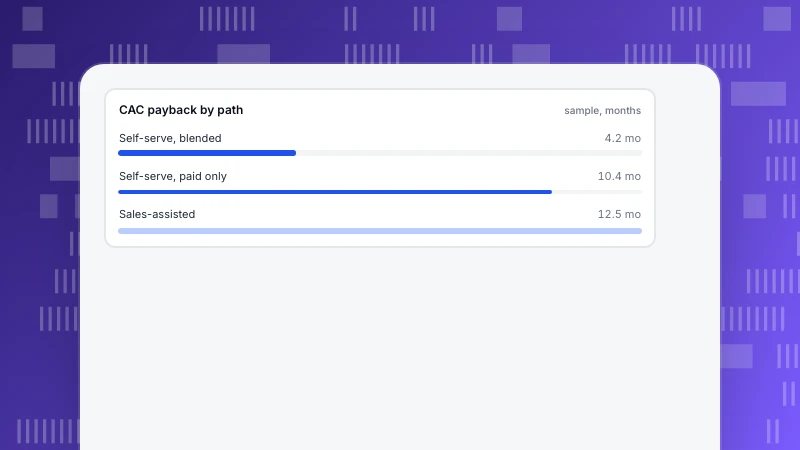
SaaS Go-to-Market Strategy: Choose One Path, Then Prove It Works
A SaaS go-to-market strategy has to decide who buys, what you offer, the price, one primary path and the proof. Self-serve, sales-assisted and channel compared, with a CAC payback example and three numbers to validate the path.
Read more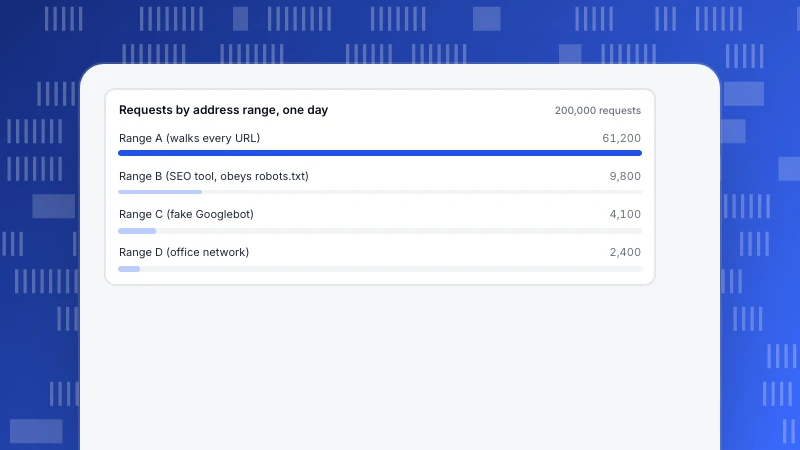
How to prevent web scraping: find who, then decide what to block
Preventing web scraping starts with measuring who is fetching what. Signals that separate scrapers from normal traffic, a one-day example, layered defences with their side effects, and what TapCub can and cannot see.
Read more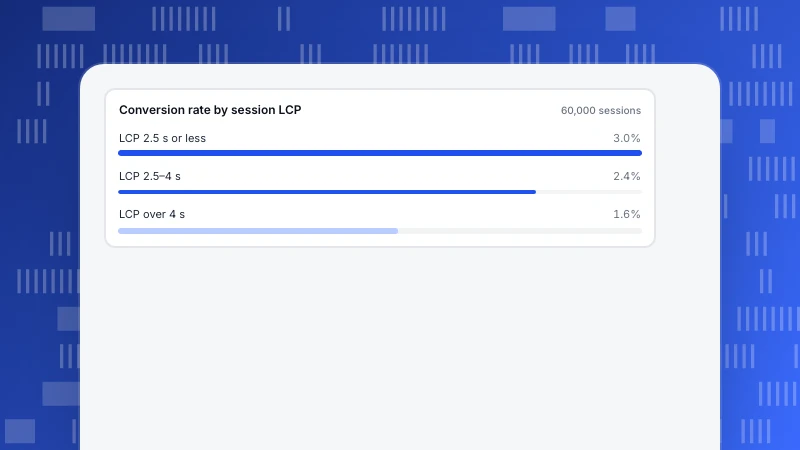
Does page speed affect SEO? What to measure before you optimize
Page speed affects SEO through two narrow routes: page experience as a tie-breaker and crawl capacity on very large sites. What Google says, the three metrics, a decision table and a before-and-after example with a control group.
Read more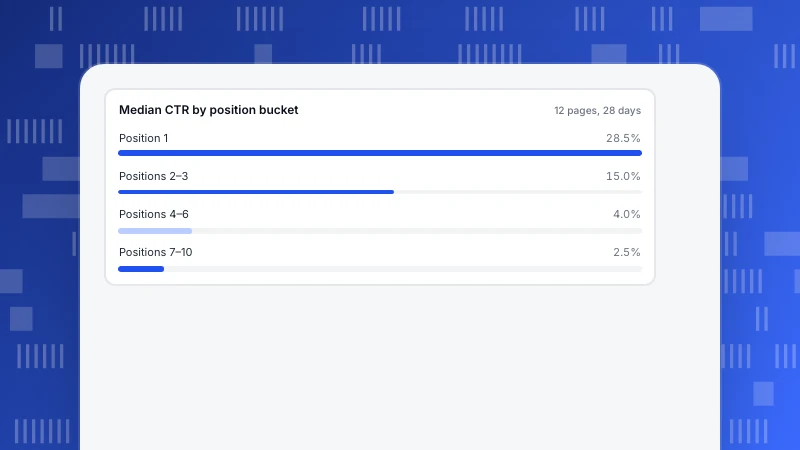
Organic CTR: how to tell whether your click-through rate is good
There is no standard organic CTR: it changes with position, intent and the result page. How to compare a page with the same-position median on your own site, diagnose title vs ranking, and test a change.
Read more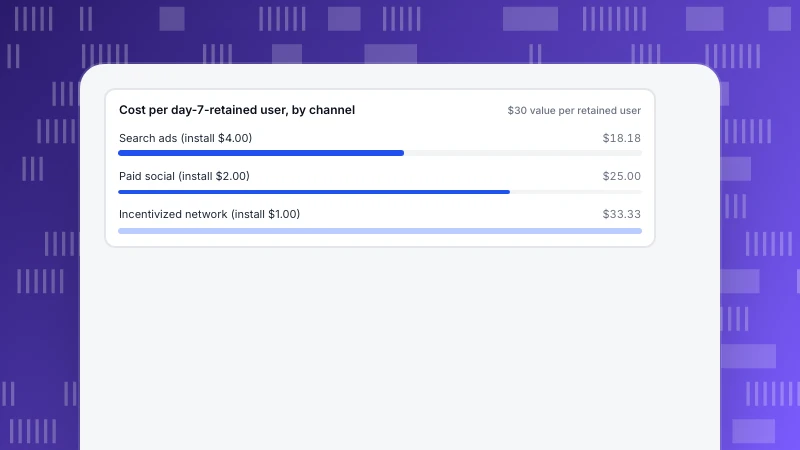
Mobile User Acquisition Strategy: Price Channels by Retained Users
A mobile user acquisition strategy should price channels by the users who stay, not the installs they deliver. A three-channel example shows install cost and cost per retained user ranking channels in exactly opposite orders.
Read more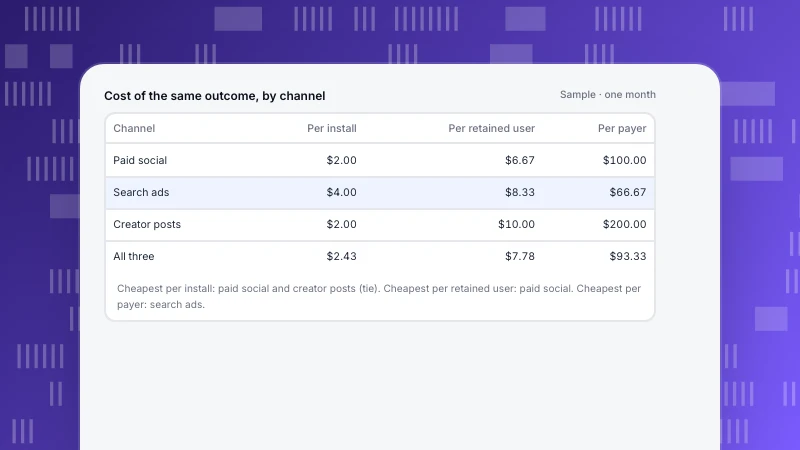
Mobile Marketing Strategy: Choose the Number Before the Channels
A mobile marketing strategy is a plan for reaching and keeping customers on phones, and its test is the number that judges each channel. A three-channel example shows cost per install, per retained user and per payer ranking channels in different orders.
Read more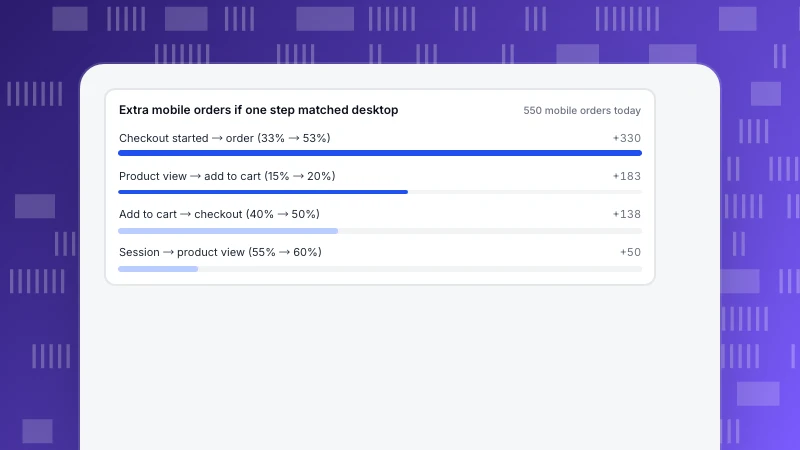
Mobile Commerce: Why Phones Bring the Traffic but Fewer Orders
Mobile commerce is shopping on phones and tablets, and it is best treated as a measurement problem. Compare traffic share with order share, split the funnel by device and find the step that costs the most orders.
Read more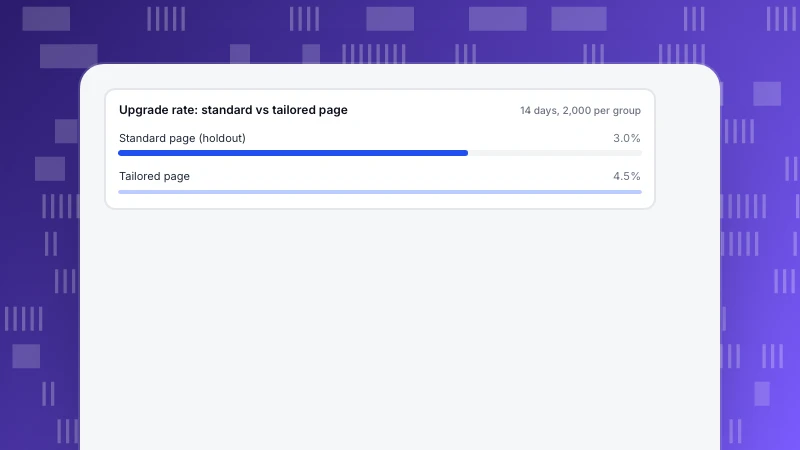
Hyper-Personalization: Start With Two Behavioral Signals and Prove the Lift
Hyper-personalization means tailoring what each person sees from their own recent behavior. Three levels, seven signals written as rules, how much data a test needs, and a worked example that proves the lift with a holdout.
Read more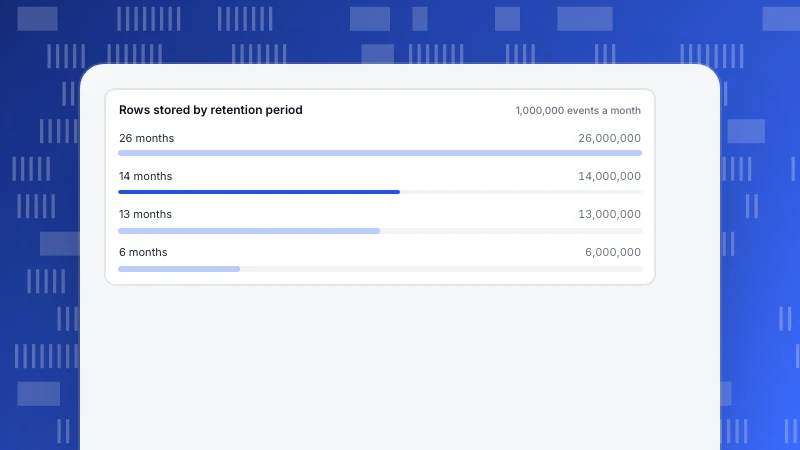
GDPR compliance checklist: four written answers, not a tick list
A GDPR compliance checklist is four written answers: what you collect, why, how long you keep it and how you delete it. A nine-row checklist with article numbers, a statistics-tool self-check and a retention example.
Read more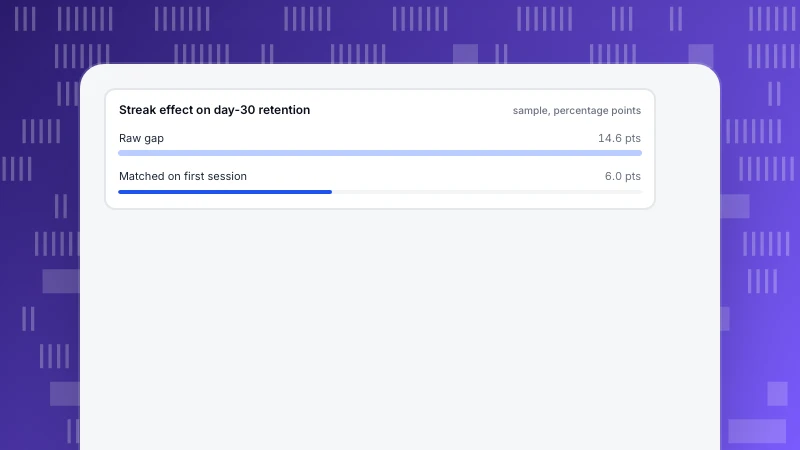
Gamification Examples: Which Mechanics Change Behavior, and How to Check
Five gamification mechanics with the behavior, metric, window and guardrail for each, what public examples actually show, and a worked streak example where a 14.6-point retention gap shrinks to 6.0 points after matching.
Read more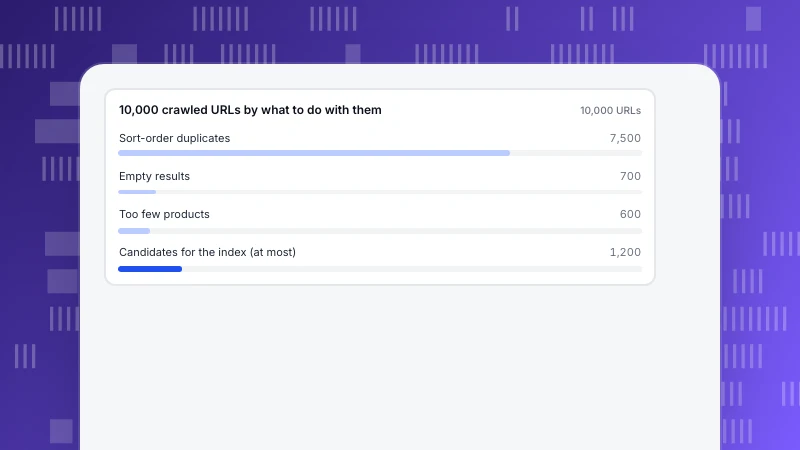
Ecommerce SEO tips: fix crawling and duplicates before content
Ecommerce SEO works in priority order: crawlable, distinct category and product pages first, content later. Filter and sort URLs, out-of-stock pages, a worked 10,000-to-1,200 URL example and how to measure orders.
Read more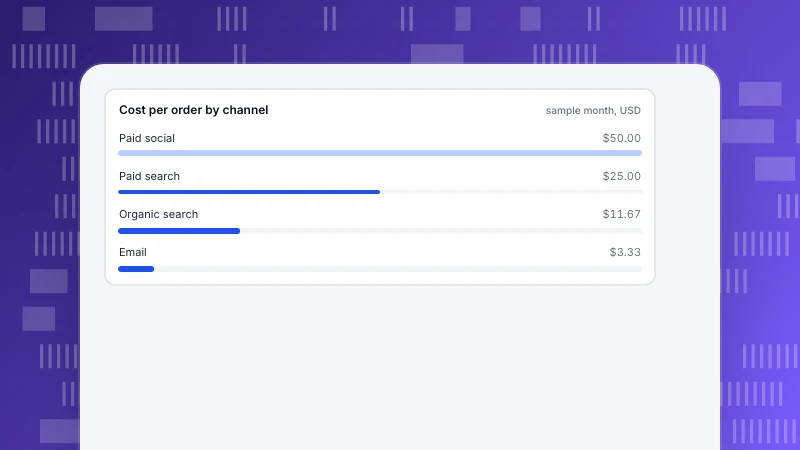
Digital Marketing Reporting: What to Include, With a Worked Channel Table
Digital marketing reporting answers three questions: where the money went, what it brought back, and what to change. A six-part template, a four-channel table you can recompute, a definitions note and how often to send it.
Read moreFive categories, one question each
Each category answers a recurring question we hear from customers. Start with the one closest to your job.
Analytics
Definitions, funnels, retention and the data-quality questions behind every number.
304 articlesGrowth & Marketing
Acquisition, marketing, site and app operations, and how to pick the one stage worth fixing first.
238 articlesLive Chat
Proactive invites, translation and turning support conversations into conversions.
78 articlesAI Search
GPTBot, ClaudeBot, PerplexityBot: who fetches your pages, what the files say and what comes back.
39 articlesProduct News
What shipped, why we built it that way, and how to turn it on.
64 articles