Try it on your own data
Every report in this article is in the free plan. One snippet for web and apps, up to 10 sites.
Start freeGamification examples work when they change a core behavior, not when they raise the number of active users. Most are one of five mechanics: points, badges, streaks, leaderboards or progress bars. Each needs a behavior to change, a metric, an observation window and a guardrail. Below: what public examples actually show, and a worked streak example where selection bias is a large part of the apparent lift.
What you will learn
- Tie every mechanic to one core behavior, one window and one failure test; points for logging in raised active users 18.0% and the core action 0.8%
- Public examples are company claims, not experiments; count active participants, not enrolled ones
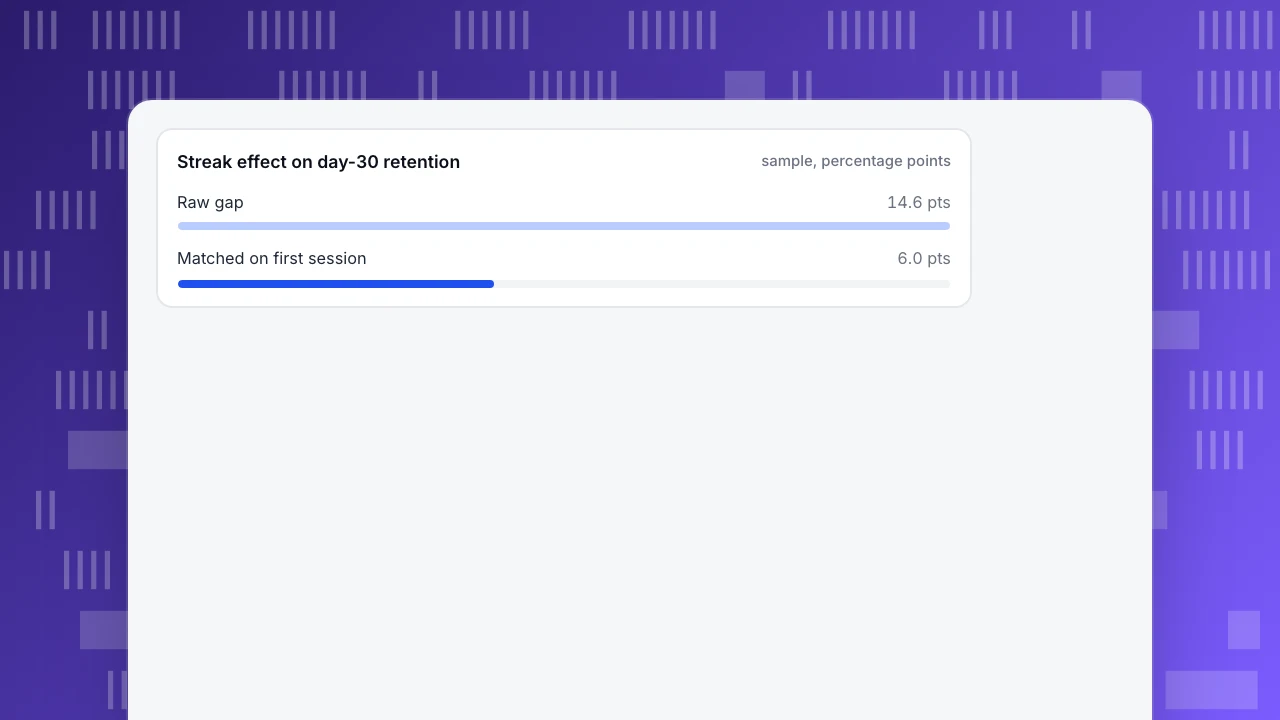
- Compare participants with similar non-participants on traits known before opt-in: a raw 14.6-point gap became 6.0 points
What counts as gamification, and the five mechanics behind most examples
Gamification is the use of game design elements in non-game contexts, a definition from academic research that has become the standard one (Deterding et al.). In a product, that usually means one of five mechanics: points, badges, streaks, leaderboards or progress bars. Most gamification examples are one of these five applied to a product action, and the useful question about each is not "does it look fun" but "which behavior is it supposed to change, and how will I know".
| Mechanic | Behavior it should change | Metric to read | Observation window | Guardrail to watch |
|---|---|---|---|---|
| Points | Repeat use or repeat purchase | Core actions per active user per week | 8 weeks | Cost of redeemed points; gaming of the rules |
| Badges | Finishing onboarding milestones | Share who complete each milestone | 2–4 weeks | Quality of completion, not only the click |
| Streaks | Coming back on consecutive days | Share with a 7-day streak; 30-day retention | 30 days | Notification opt-outs, uninstalls |
| Leaderboards | Effort among competitive users | Core actions per participant, by rank band | 4–8 weeks | Activity of users at the bottom of the board |
| Progress bars | Finishing a multi-step task | Step and task completion rate | Same session to 7 days | Completion of low-value steps |
The thesis of this guide is that gamification has worked when it changes the core behavior, not when it raises the number of active users. A mechanic that increases logins but not the action that delivers value to the user is decoration. Every row above therefore ties a mechanic to a behavior and a window; if you cannot fill the row in for your product, you are not ready to build the mechanic.
What public examples actually show
Many "gamification examples" lists describe brands and mechanics. A few sources let you check what is actually claimed:
| Example | Mechanic | What the source says | What it does not show |
|---|---|---|---|
| Duolingo | Streaks and leaderboards | Its 2021 S-1 says it builds gamification features into the platform to motivate learners, that these features motivate learners to come back each day, and names Leaderboards and Streaks as features that make subscriptions stickier (Duolingo S-1). Its blog says early metrics after a streak redesign showed more people keeping their streaks alive (Duolingo blog) | How much of the retention comes from the streak rather than from the people who choose to keep one; no figure for the redesign |
| Starbucks Rewards | Points-based loyalty | In fiscal Q3 2024 it reported 33.8 million U.S. members counted as active over a 90-day window (Starbucks) | What purchases members would have made without the program |
| Research review | Several | A review of 24 empirical studies found positive effects, but dependent on context and on the users (Hamari et al.) | Which mechanics work for your product |
Two lessons. First, company statements are claims, not experiments: "motivates users to come back" describes intent and association, and the figures that exist are counts of participants. Second, the most carefully built metric in the table is Starbucks': members are counted as active over a window, not as enrolled, so the number cannot be inflated by sign-ups alone. Use that standard for your own program: count active participants, not enrolled ones. Ways to lift app engagement more broadly are in increase app engagement, and the behavioral model behind many of these mechanics is the hook model.
Attach one behavior, one window and one failure test to each mechanic
Before you build, write one sentence per mechanic: "We expect [mechanic] to raise [core behavior] from [X] to [Y] within [window], and we will call it failed if [guardrail] gets worse." The core behavior is the action that delivers value, not presence:
| Product | Core behavior to measure | A vanity number to avoid |
|---|---|---|
| Notes app | Notes created per active user per week | Daily active users |
| Language app | Lessons completed | App opens |
| Project tool | Projects or tasks created and shared | Logins |
| Online store | Repeat orders within 60 days | Points earned |
Sample data: a project tool adds "points for logging in". In the following month, daily active users rise from 10,000 to 11,800, +18.0%. Projects created per active user per week move from 1.20 to 1.21, +0.8%, and 30-day retention from 22.0% to 22.4%, +0.4 points. The activity number looks like a win; the core behavior did not change. The mechanic rewarded the wrong thing. Engagement measures worth tracking beside this are in engagement metrics.
Worked example: streak participants versus non-participants
Sample data: 20,000 new users in a month. A daily-streak feature is optional; 6,000 turn it on in their first week ("participants") and 14,000 do not. Retention at day 30 is the core metric.
The naive comparison
- Participants retained at day 30: 1,500 of 6,000 = 25.0%.
- Non-participants: 1,460 of 14,000 = 10.4%.
- Raw gap: 25.0% − 10.4% = 14.6 points, a relative lift of 25.0 ÷ 10.4 − 1 = 140%.
Taken at face value, the streak feature added 6,000 × 14.6% = 874 retained users. That is too good to be true, because users who turn on a streak feature are the ones already inclined to come back. The way to estimate how much is selection is to compare like with like on something known before the opt-in. Here: length of the first session, split into long (5 minutes or more) and short.
| First session | Group | Users | Retained at day 30 | Rate |
|---|---|---|---|---|
| Long | Participants | 2,400 | 960 | 40.0% |
| Long | Non-participants | 1,600 | 592 | 37.0% |
| Short | Participants | 3,600 | 540 | 15.0% |
| Short | Non-participants | 12,400 | 868 | 7.0% |
The matched comparison
- Long first session: 40.0% − 37.0% = 3.0 points.
- Short first session: 15.0% − 7.0% = 8.0 points.
- Weighted by where the participants actually are: (2,400 × 3.0% + 3,600 × 8.0%) ÷ 6,000 = (72 + 288) ÷ 6,000 = 6.0 points.
The adjusted effect is 6.0 points, 41% of the raw 14.6. Incremental retained users: 6,000 × 6.0% = 360, not 874. About 59% of the naive gap, 514 users, was selection. The method is the idea behind propensity-score matching in observational studies (Rosenbaum and Rubin). Two cautions: stratify only on things known before the opt-in (first-session length, channel, platform), because splitting on something that happens after, such as week-one activity, mixes in the effect you are measuring; and unmeasured differences remain, so 6.0 points is an estimate, probably still a little high. The general concept is in selection bias.
How to compare when you cannot split traffic
A randomised holdout is the strongest design, but it needs a feature-flag or experimentation tool. When you do not have one, choose the least biased alternative and say which bias remains:
| Design | How | Bias to expect | What to do about it |
|---|---|---|---|
| Before and after | Compare the 4 weeks before launch with the 4 weeks after | Seasonality, other releases, novelty | Compare the same weekdays; use a 4-week lead-in; read at day 30, not day 3 |
| Staggered rollout | Launch in one platform or country first, compare with the others | Platform and country differences | Compare against the same group's own pre-launch trend |
| Matched comparison | Compare participants with non-participants similar on pre-opt-in traits | Unmeasured differences | Stratify on several pre-opt-in traits; treat the result as an upper bound |
| Dose-response | Check whether more participation goes with more retention | The most motivated participate most | Use only as supporting evidence |
Novelty deserves its own check. Early excitement fades, so a mechanic that lifts day 3 retention can have no effect at day 30. Read the whole retention curve, not one point, and see the novelty effect for how long it usually lasts.
Mistakes that make gamification look better than it is
- Measuring activity rather than the core behavior. The login-points example: +18.0% active users, +0.8% on the core action.
- Comparing finishers with non-finishers. Only people who stay can earn a 7-day streak, so a streak group trivially retains better. Define participation by what a person did before the outcome window starts, such as opting in.
- Reading day 3 as success. Check day 30. Excitement at launch fades.
- No guardrail. A streak that drives notifications can raise opt-outs and uninstalls. Put the guardrail from the first table beside the headline.
- Copying a brand's mechanic without its context. A review of the research finds effects depend on context and users, so a mechanic that suits a language app can fail in a project tool.
- Rewarding the wrong action. Points for opening the app teach users to open the app. Reward the core behavior or nothing.
How to check a gamification mechanic in TapCub
Use the streak example: 20,000 new users, an optional streak, and day-30 retention as the question.
- Send the events. Track the mechanic as events: for example
streak_enabled,streak_day_7,badge_earned, and the core action such asproject_created. New events first land in the event inbox, where you claim them before they join the formal definitions. - Define participants and the rest. In All-platform analytics › Users › Segments & tags, save a rule segment "did
streak_enabledin the first 7 days" and another for those who did not. Both are saved audiences you can reuse. - Run retention for each. In All-platform analytics › Behavior › Behavior analysis, open retention, set the start event to sign-up and the return event to your core action, and apply each segment as the cohort in turn. Retention has no compare period or breakdown, so run it twice and read the two day-30 rates side by side. To reproduce the matched comparison, add a trait known before the opt-in as a filter, such as channel or platform, or first-session length if you store it as a user property.
- Check the core behavior and the guardrails. Use the funnel from onboarding to your core action, and event analysis for the guardrail events, such as notification opt-outs, if you track them.
- Know the boundary. TapCub does not split traffic or run experiments, so a randomised holdout needs your own flag system; if your app sets a user property for the group, TapCub can then compare the two. It measures the groups you define and does not remove selection bias for you, so state the bias with the result.
FAQ
What are examples of gamification?
The usual ones are points (loyalty programs), badges (onboarding milestones), streaks (daily lessons or workouts), leaderboards (competition among users) and progress bars (finishing a profile or a course). Duolingo's streaks and leaderboards and Starbucks Rewards are publicly documented; treat their figures as company statements, not experiments.
Does gamification actually work?
Sometimes. A review of 24 empirical studies found mostly positive effects, but they depended on context and the users involved. Whether it works for you depends on whether it changes your core behavior, such as day-30 retention or repeat purchases, measured against a fair comparison.
How do you measure gamification success?
Pick one core behavior and a window, then compare participants with similar non-participants on traits known before opting in. In the sample, the raw 14.6-point retention gap shrank to 6.0 points after matching. Add guardrails such as opt-outs, and read day 30, not day 3.
What is the most common gamification mistake?
Rewarding activity instead of the core behavior, or comparing people who finished a mechanic with people who did not. Both make a mechanic look effective by construction. Reward the action that delivers value and compare on traits known before the mechanic started.
Can you test gamification without A/B testing?
Yes, with a weaker design: a staggered rollout, a before-and-after comparison on the same weekdays, or a matched comparison. Each has a known bias, so report it with the number and treat the result as an upper bound. A randomised holdout is stronger if you can run one.
Sources
- Sebastian Deterding, Dan Dixon, Rilla Khaled and Lennart Nacke. From Game Design Elements to Gamefulness: Defining "Gamification". Proceedings of MindTrek 2011, ACM. The definition used in this guide. Record checked 2026-11-17.
- Juho Hamari, Jonna Koivisto and Harri Sarsa. Does Gamification Work? A Literature Review of Empirical Studies on Gamification. 47th Hawaii International Conference on System Sciences, 2014. 24 empirical studies; positive effects that depend on context and users. Record checked 2026-11-17.
- Duolingo, Inc. Form S-1, 2021. Statements on gamification, Streaks and Leaderboards. Read 2026-11-17.
- Paul R. Rosenbaum and Donald B. Rubin. The central role of the propensity score in observational studies for causal effects. Biometrika 70(1), 1983. Comparing like with like on observed characteristics.
- Starbucks Corporation. Q3 fiscal 2024 results. Starbucks Rewards 90-day active U.S. members. Checked 2026-11-17.
Was this article helpful?
We use your answers to fix and expand this page.
Couldn’t send. Please try again in a minute.
Thanks for the feedback. We’ll use it to improve this page.You’ve already sent feedback on this page. Thanks.

Product Adoption Consultant
Explores customer onboarding, live conversations, and self-service, turning common usage questions into practical guidance and improvements.