Blog Analytics, growth and chat, explained with real numbers · Page 10
Practical notes from the team building TapCub: how metrics are defined, where funnels break, what AI crawlers take from your site, and how support teams turn conversations into conversions.
Browse every article
Filter by category or search a keyword. Every article links to the report or setting it talks about.
723 articles · page 10 of 16
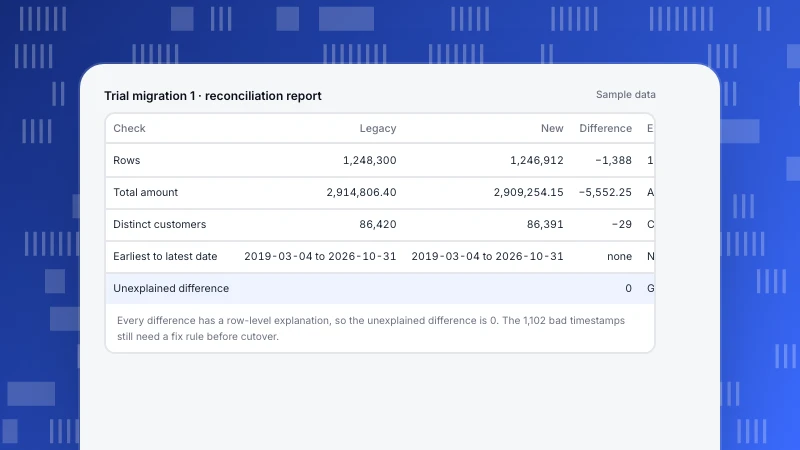
Data migration project: a five-phase plan with reconciliation checks
A data migration project succeeds on the inventory before it and the reconciliation after it. Five phases with gates, a worked reconciliation, rollback conditions, an eight-week timeline and how to run it for analytics.
Read more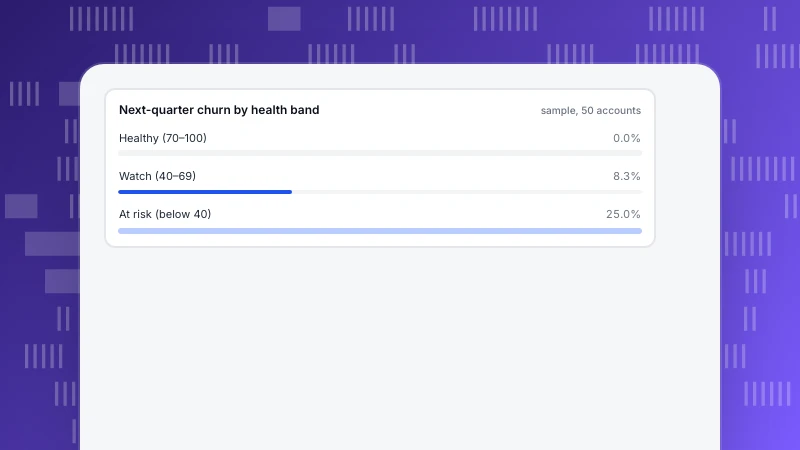
Customer Success KPIs: Which Ones Warn You Before a Customer Leaves
Customer success KPIs split into outcome numbers (churn, GRR, NRR) and leading numbers (active members, time to first value, health score). A renewal-quarter example, a backtested health score and a six-number dashboard.
Read more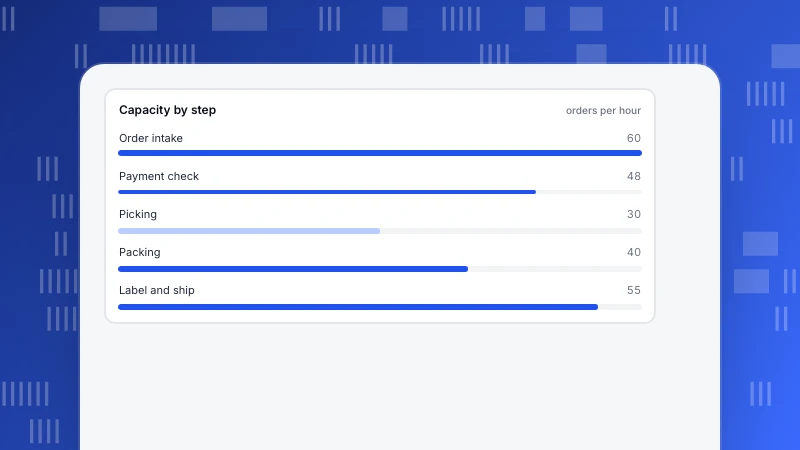
What Is a Bottleneck in Business? How to Find the Slowest Step With Data
A bottleneck is the one step that caps the output of a whole process. Four types, a worked five-step example, how to find it with conversion and wait-time data, and what fixing it is worth.
Read more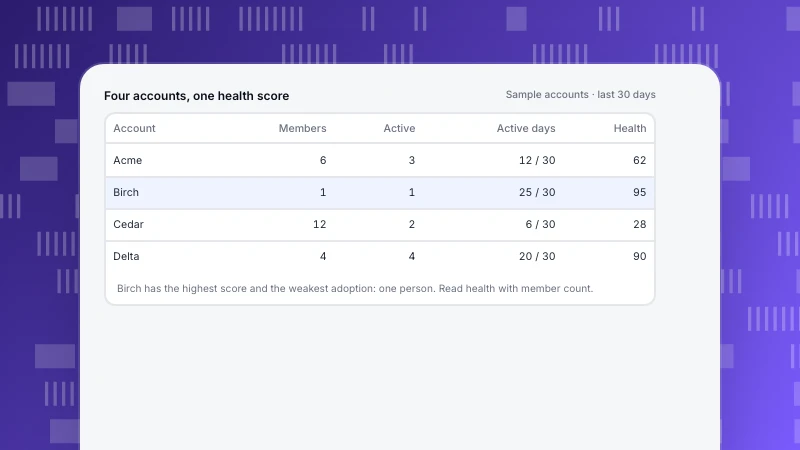
B2B Customer Journey: How to Measure Stages at the Account Level
A B2B customer journey belongs to the account, not one person. Five stages with an observable signal each, a four-account health score example, rules to roll members up into a stage, and the mistakes that mislead.
Read more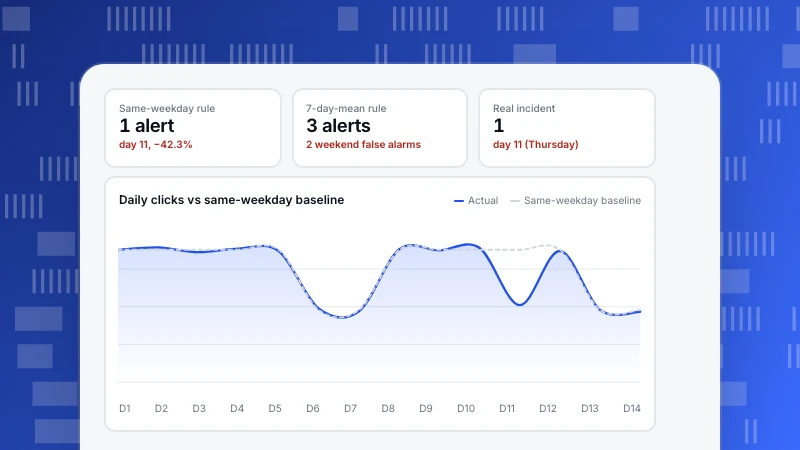
Automated SEO monitoring: four signals to watch and the alert rules to set
Automated SEO monitoring only helps if you know what to watch and what change should wake someone up. Four signal types with starting thresholds, why weekday and rank noise cause false alarms, and how to test a rule first.
Read more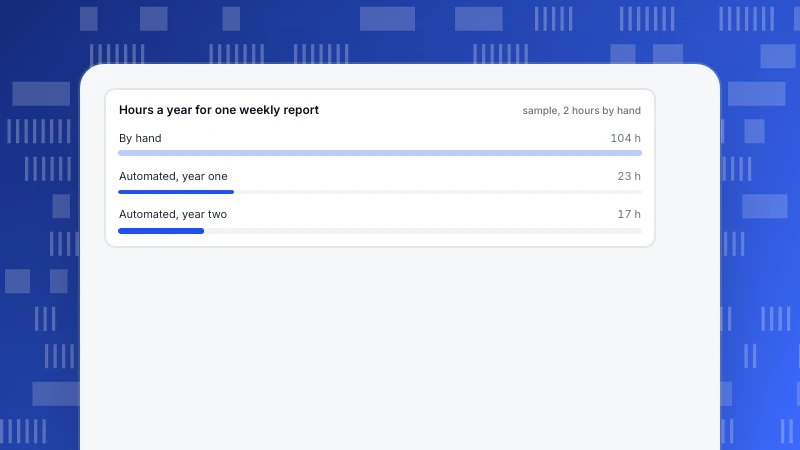
Automated Reports: Fix the Definitions First, Then Schedule Them
Automated reports build themselves and arrive on a schedule, which also repeats any wrong definition faster. Four steps, a one-page definitions table, a frequency guide and a recomputed time-saved example.
Read more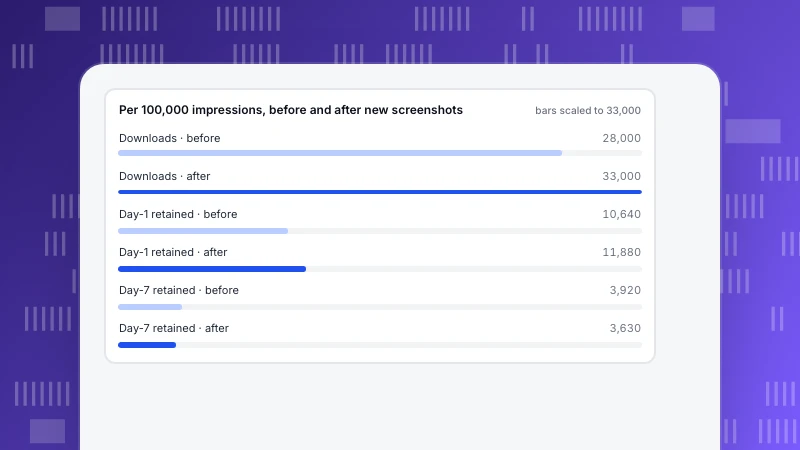
ASO Guidelines: Platform Rules, Tests and the Retention Check
ASO guidelines cover what Apple and Google allow in a store listing and how to tell whether a change helped. A before-and-after example shows downloads rising 17.9% while day-7 retained users fall 7.4%.
Read more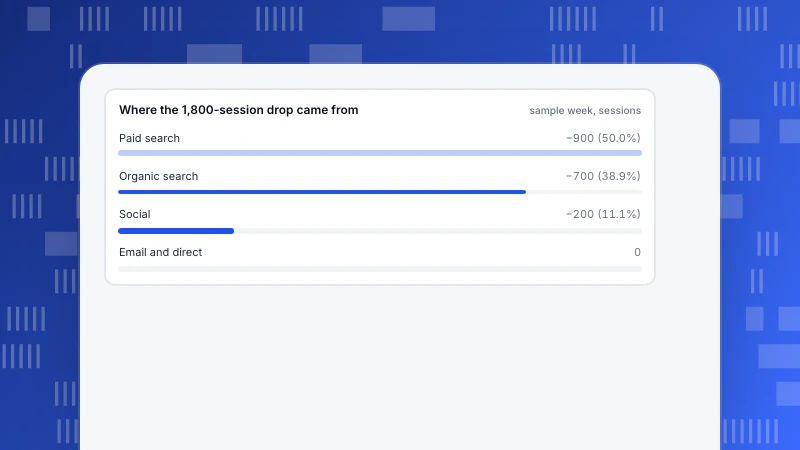
AI Marketing Analytics: What It Can Do, and How to Check Its Answers
AI marketing analytics is safest as a way to ask your data, not to decide for you. Four uses and how far to trust each, how to phrase a question, an 18% traffic drop split by channel, and six checks before you act.
Read more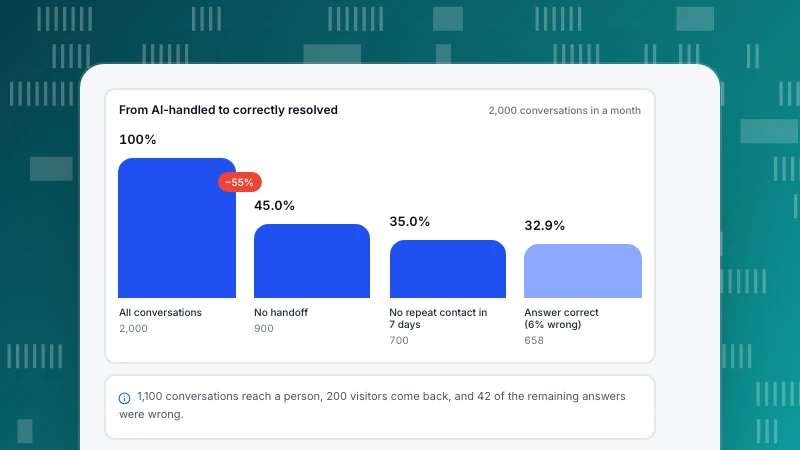
AI Help Desk: What AI Should Answer and How to Hand Off
An AI help desk answers stable, written-down questions first and hands everything else to people with the context. A worked month shows 45% handled shrinking to 35% truly resolved, plus a quality-check method.
Read more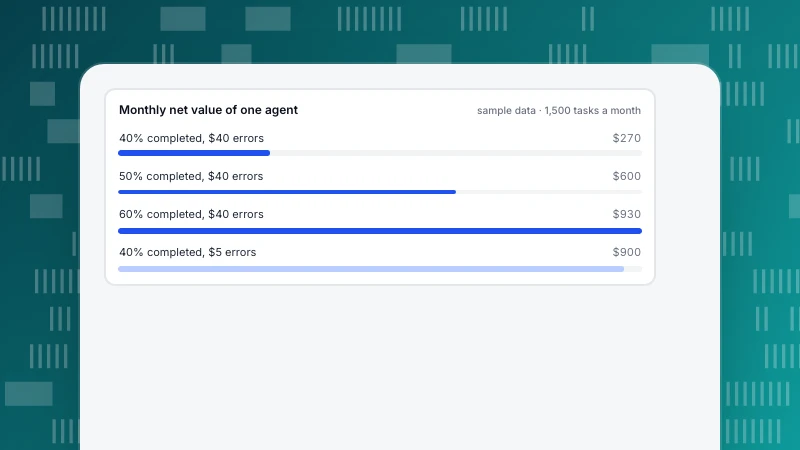
AI Agents for Business: Where to Start and How to Control Risk
AI agents for business pay off on tasks with a measurable success criterion and a low cost of failure. Three tests for choosing a task, an eight-point risk checklist, a worked break-even and a trial method.
Read more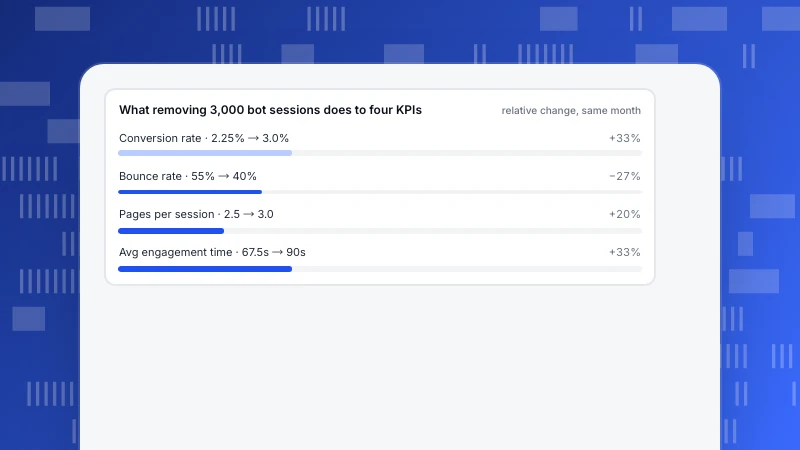
Website KPIs: how to choose the few numbers that matter
Pick website KPIs backward from the job your site must do: one primary KPI, three to five explainers, clean denominators, and targets you can recompute. With KPI trees for four site types and two worked examples.
Read more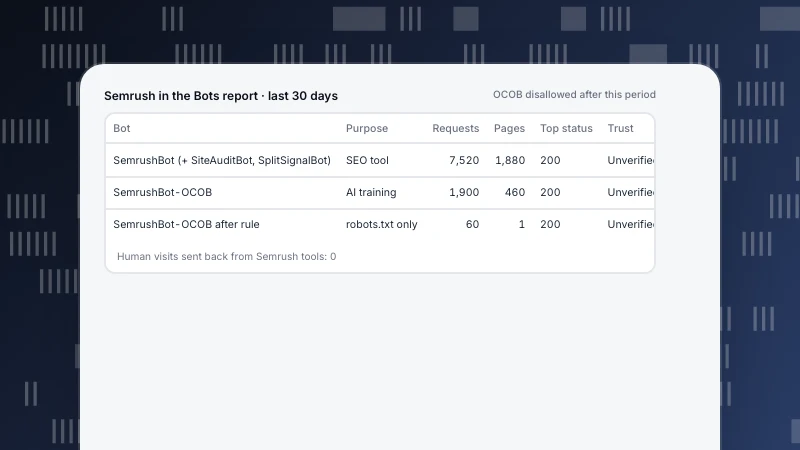
SemrushBot: The 10-Agent Family and How to Control Each One
SemrushBot is a family of ten Semrush crawlers with independent robots.txt tokens. What each does, how to keep SEO data while opting out of SemrushBot-OCOB, how to verify requests, and how to decide per goal.
Read more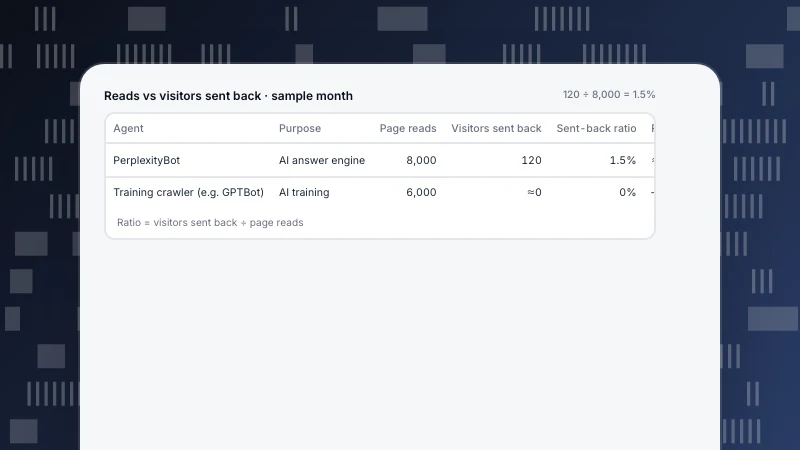
PerplexityBot: What It Reads, What It Sends Back, and Whether to Allow It
PerplexityBot reads pages so Perplexity answers can cite your site; Perplexity-User fetches on user request. What each does, robots.txt rules, IP verification, and a reads-vs-visitors rule for allowing or blocking.
Read more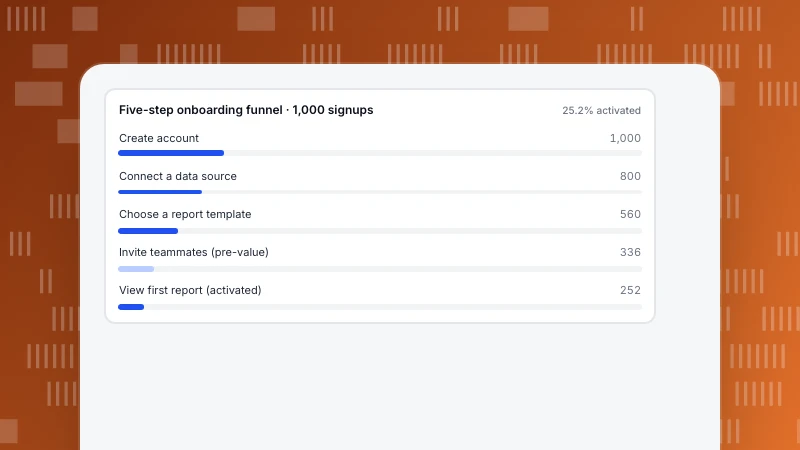
Onboarding flow: formats, design steps, and a worked funnel example
An onboarding flow ends when the user first gets value, not when they finish the tour. Compare four formats, design backward from activation, cut the biggest pre-value drop with a recomputable funnel example, and verify the change with cohorts.
Read more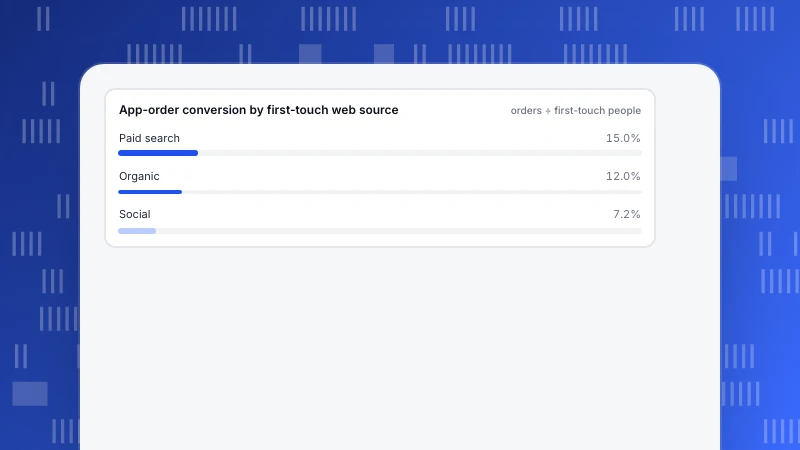
Omnichannel analytics: connect the same person before comparing channels
Omnichannel analytics unifies web, app and mini-program data into one person-level journey. Why per-channel reports double-count people, how to stitch identity and events, a recomputable cross-channel example with four attribution models, and the limits.
Read more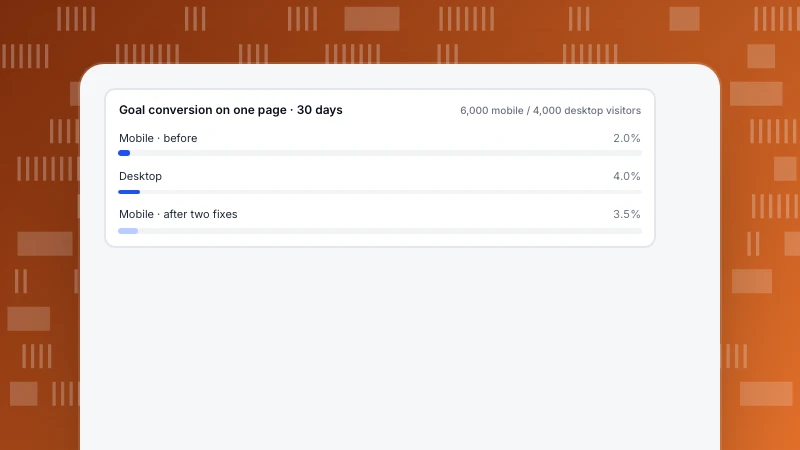
Mobile UX: Find the Problems in Your Data Before You Redesign
Mobile UX is the whole phone experience: loading, touch, navigation and error recovery. Find the five common problems in device-split data first — rage clicks, scroll cliffs, slow LCP — then fix them in priority order, with a recomputable mobile-vs-desktop example.
Read more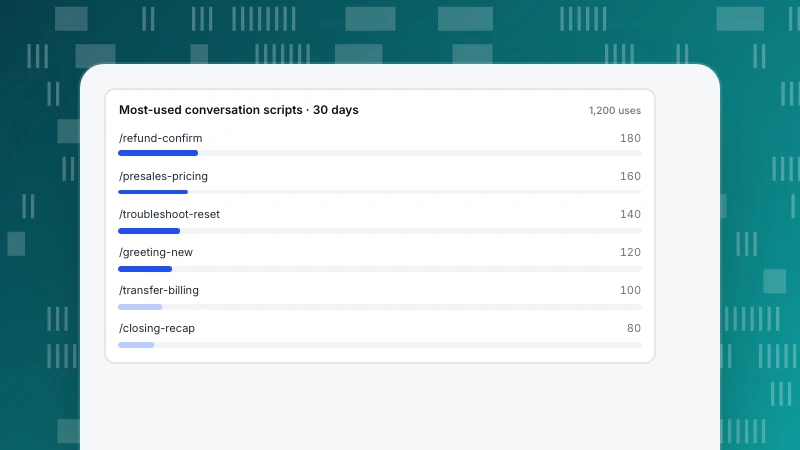
Live chat scripts: 21 conversation templates that don't sound scripted
Live chat scripts are multi-turn conversation templates that lock the structure and must-say information while leaving wording to the agent. Here are 21 templates across 7 scenarios, when to go off-script, and a 30-day audit that shows which scripts to keep, rewrite or retire.
Read more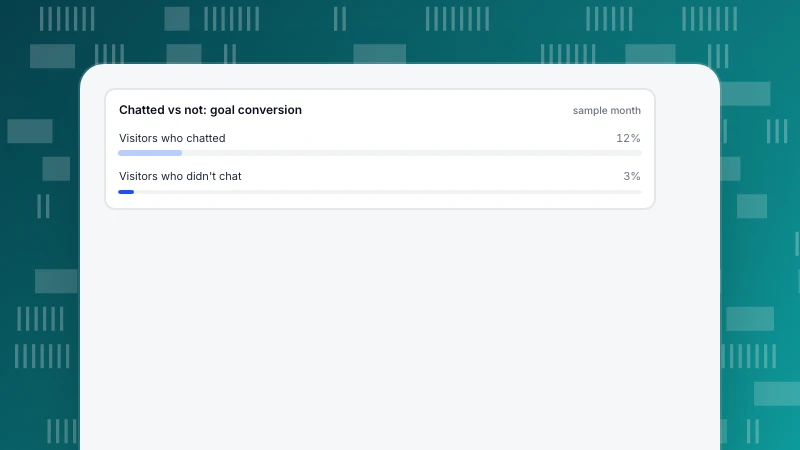
Customer Service Chat: A Team Playbook for Staffing, Routing and Metrics
Run customer service chat as a real service channel: what belongs in chat versus email and phone, a staffing worked example, routing and handoff rules, and four metrics with a recomputable sample month.
Read more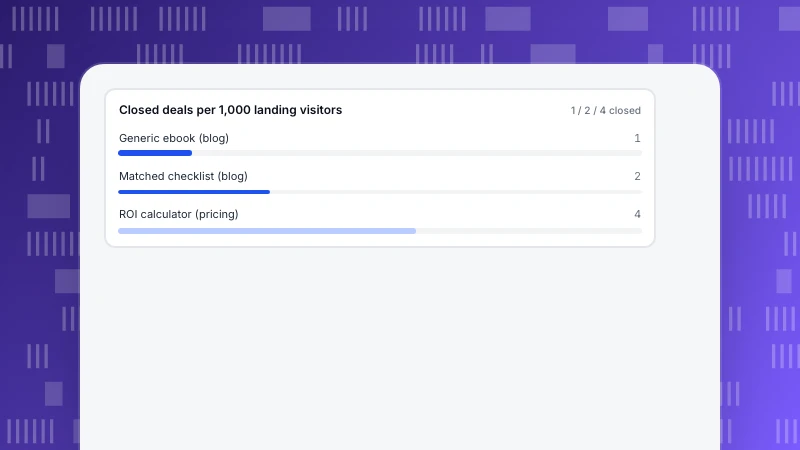
Lead Magnet Examples: 15 Ideas Matched to Visitor Intent
Fifteen lead magnet examples grouped by what the visitor is doing on the page — learning, comparing or deciding — each with format, effort, fit, gate and the metric to watch. Plus a recomputable example showing why qualified leads beat download counts.
Read more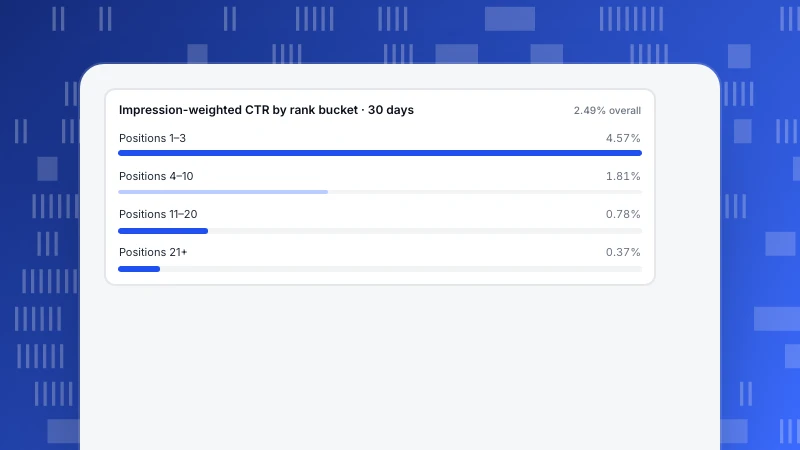
Keyword Performance Report: Template, Worked Example, and Monthly Cadence
A keywords performance report should answer one question: which page do I change next? Here is a nine-column template, a 20-query example with impression-weighted CTR by rank bucket, and a monthly cadence — every number recomputable.
Read more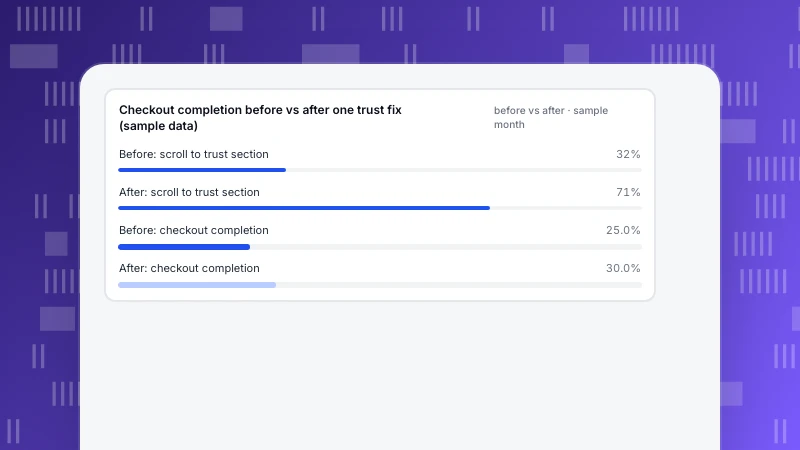
Ecommerce Trust Signals: Put Them Where Shoppers Hesitate
Ecommerce trust signals only work at the hesitation point — price, shipping, checkout, returns. Which signals matter most, where each goes by buying stage, how to find hesitation points with data, and one recomputable fix.
Read more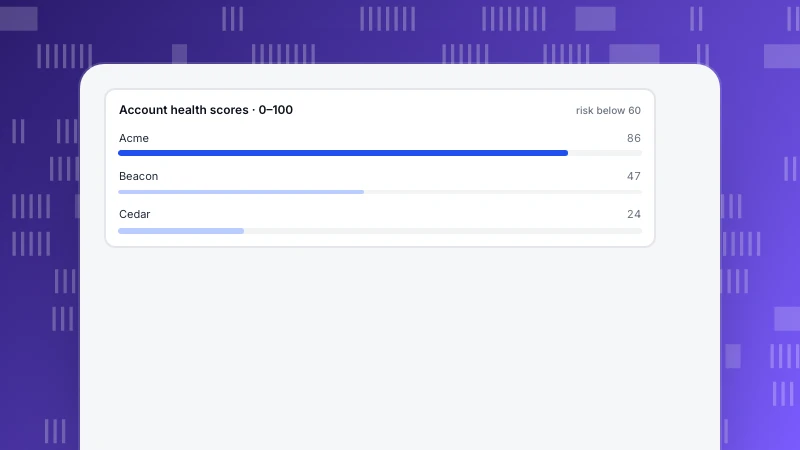
Customer success strategy for SaaS: stages, health scores, tiers and plays
Find problems before customers do: four lifecycle stages with early-warning signals, a health score you can recompute, ARR-by-health tiering with capacity math, trigger-action-owner playbooks, and the GRR/NRR cohort math that proves it works.
Read more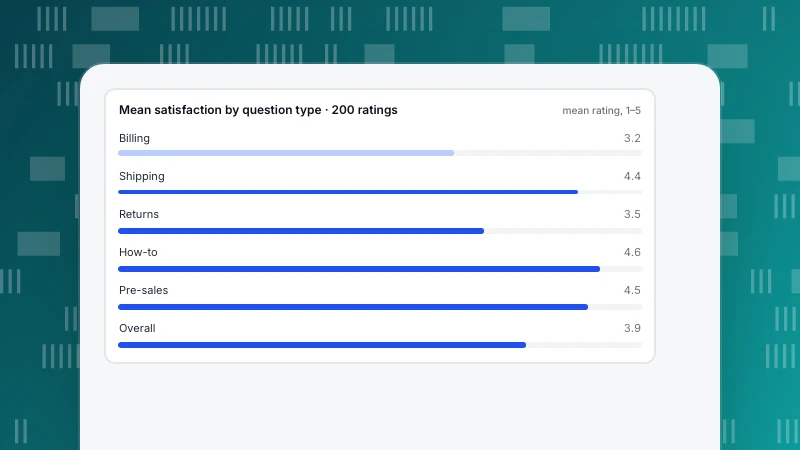
Customer service questions: what to ask after a chat, and what to ask during one
Customer service questions work when there are few of them and each maps to a decision you would change. A keep/drop test for post-service surveys, diagnostic sequences for agents, and a month of sample data read two ways.
Read more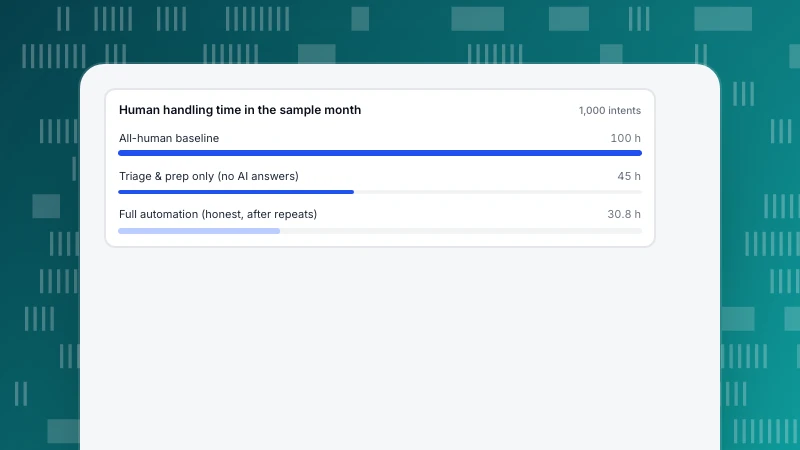
How to Automate Customer Service: Triage First, Answers Second
Automate customer service in the right order: triage and preparation first (routing, canned replies, offline fallback, knowledge base), then AI answers. A nine-part map, stage gates, three reply templates, hard handoff rules, and a sample month you can recompute.
Read more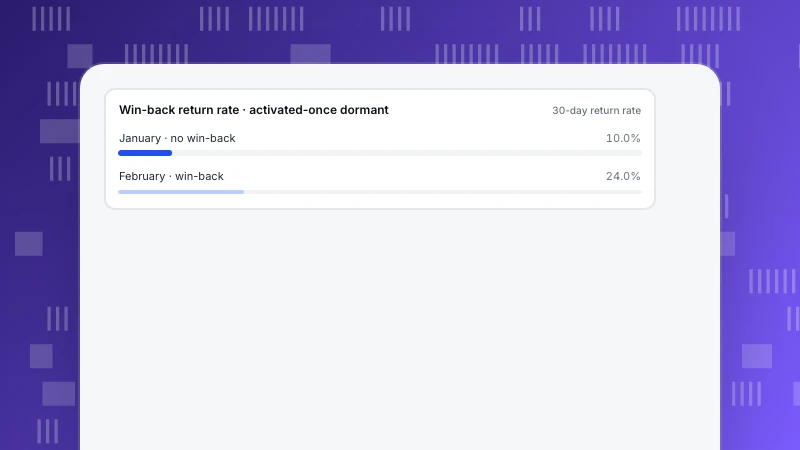
Customer Retention Examples: 12 Tactics Grouped by Why People Leave
Twelve customer retention examples grouped by why people leave — never reached value, friction, forgot, pulled away, payment — each with a tactic, when to use it and a metric, plus a recomputable win-back before/after.
Read more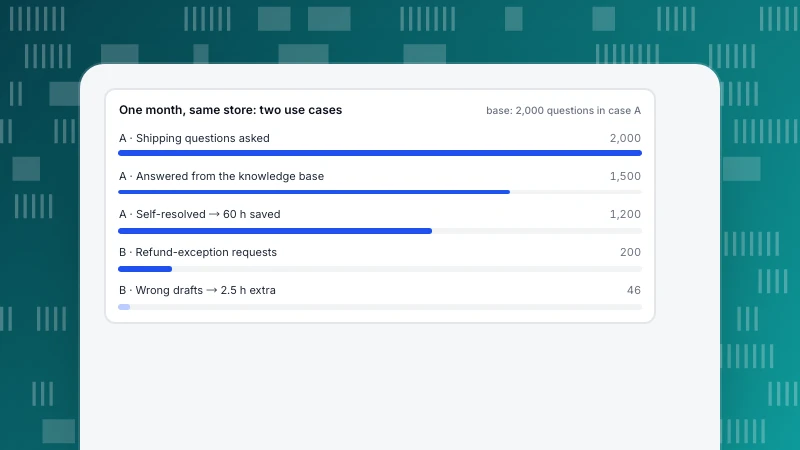
Chatbot use cases: 12 examples and a two-axis test for what to automate
12 chatbot use cases sorted by answer stability and error cost: what to automate first, where a human must confirm, what stays human-only, and a recomputable one-month example.
Read more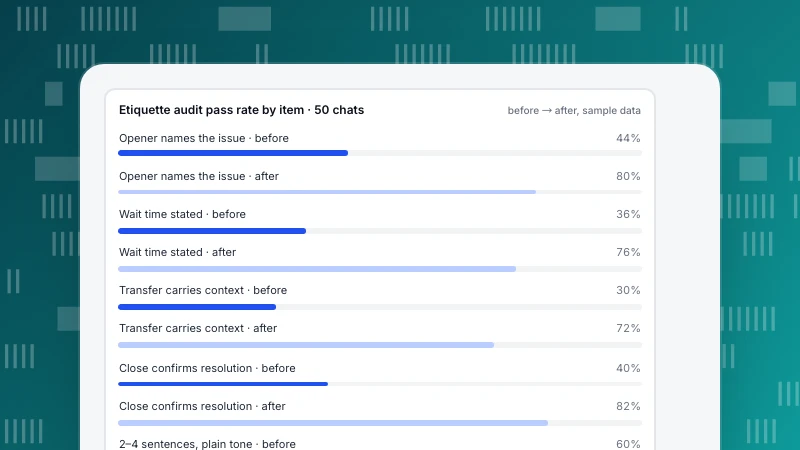
Chat Etiquette: Rules for Every Moment of a Live Chat
Chat etiquette is fewer round-trips to the answer, not a politeness list. Rules and good/bad examples for opening, waiting, transferring and closing, a full 11-to-6 rewrite, and a 50-chat audit you can recompute.
Read more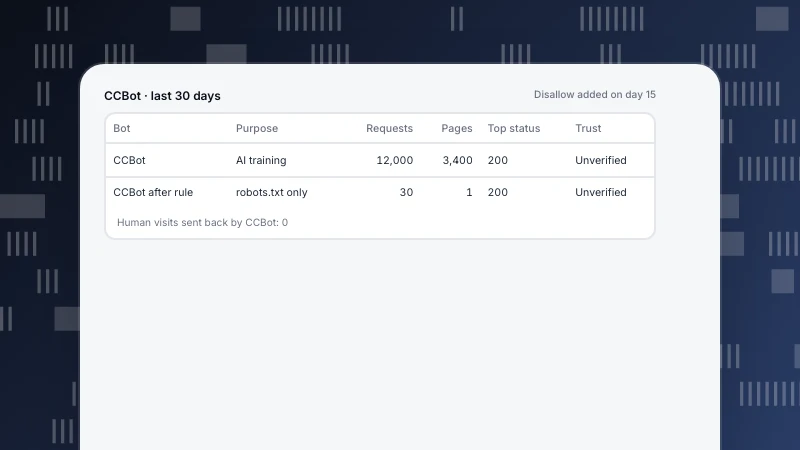
CCBot: Common Crawl's Dataset Crawler and What Blocking It Changes
CCBot builds Common Crawl's free public dataset — a documented training source for GPT-3, LLaMA and BLOOM. What it fetches, how to verify it, robots.txt rules, and why blocking only shapes future snapshots.
Read more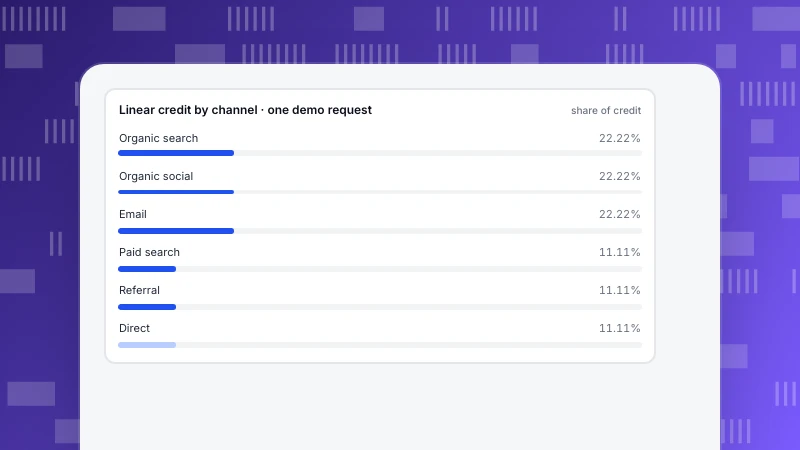
B2B Marketing Attribution: Count Credit at the Account Level
B2B marketing attribution has to be counted at the account level, not the person level. A reproducible example — one account, four people, nine sessions across 88 days — scored under five models, plus lookback-window truncation, model choice and the analytics–CRM split.
Read more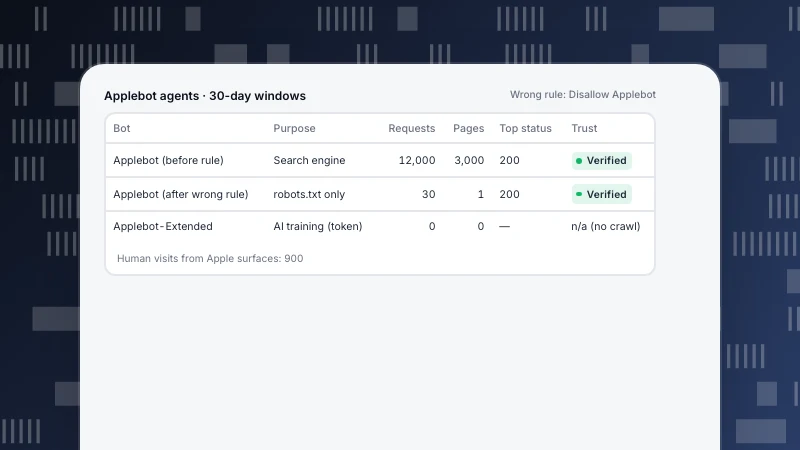
Applebot and Applebot-Extended: Two Agents and How to Control Each One
Applebot crawls for Spotlight, Siri and Safari search; Applebot-Extended is only a robots.txt switch for AI training. What each does, three rule choices, DNS and IP verification, and a worked example of what the wrong block costs.
Read more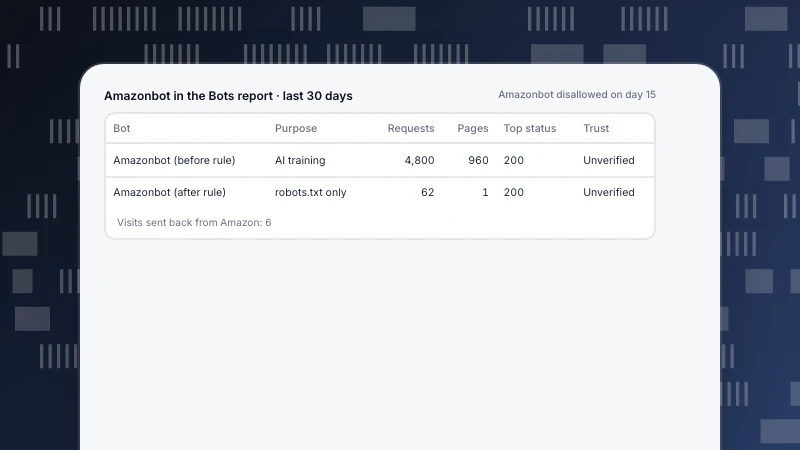
Amazonbot: Amazon's Three Crawlers and How to Control Each One
Amazonbot is Amazon's crawler whose reads may be used to train Amazon AI models — one of three Amazon agents with independent robots.txt settings. What each does, rules per goal, IP verification, and a worked example of reads versus traffic sent back.
Read more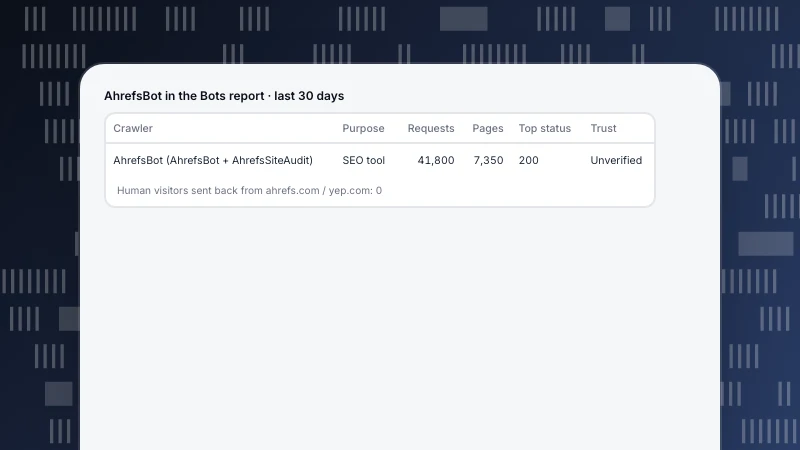
AhrefsBot: What It Does and Whether to Allow or Block It
AhrefsBot reads your site for Ahrefs users — including competitors — and sends back no visitors. What its two crawlers do, robots.txt allow/block/rate-limit rules, verification, and how to decide.
Read more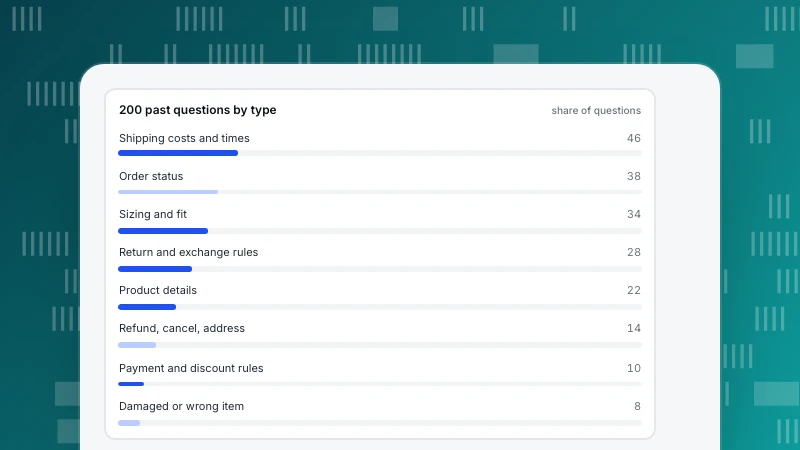
AI Chatbot for Ecommerce: What to Automate and What to Hand Off
How to launch an AI chatbot for ecommerce that answers sizing, shipping and returns accurately and hands order and refund questions to people: a 200-question sizing example, five launch steps, legal risks and metrics.
Read more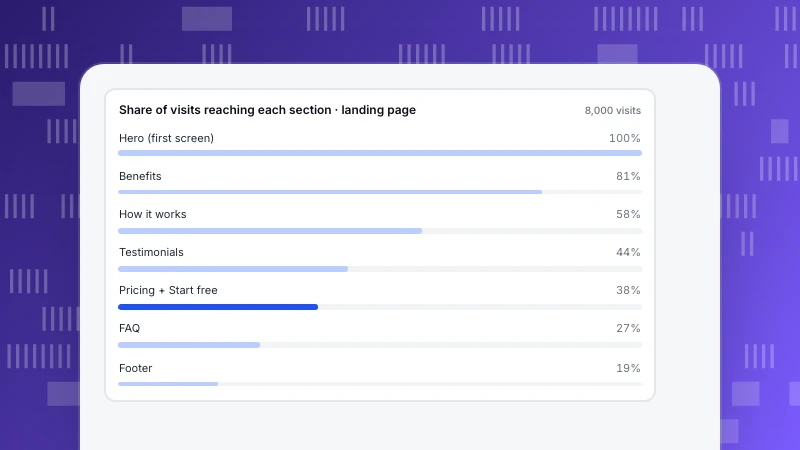
Website layout: order the page by visitor task, then check what people see
Website layout types and when to use each, what eye-tracking research actually shows, what belongs above the fold, and how to use scroll reach and click maps to check a layout before and after you change it.
Read more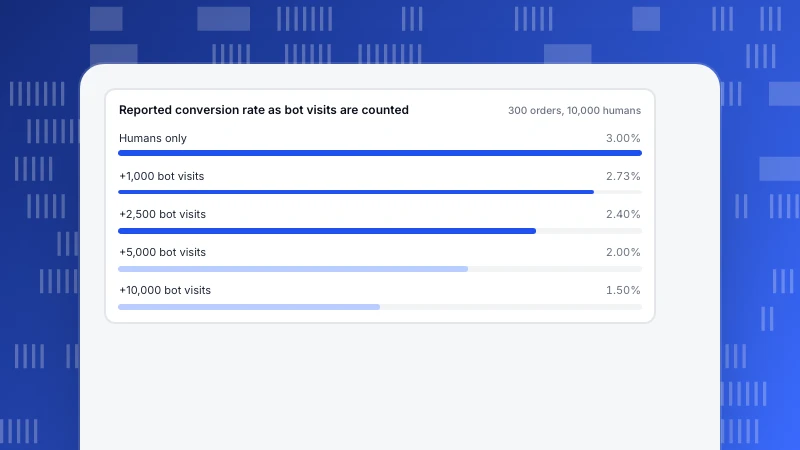
Types of bias in data analysis: the four stages and what to check first
Bias in data analysis enters at one of four steps: sampling, measurement, analysis or interpretation. A table of each type with examples, a worked bot-traffic calculation and a checklist for your own reports.
Read more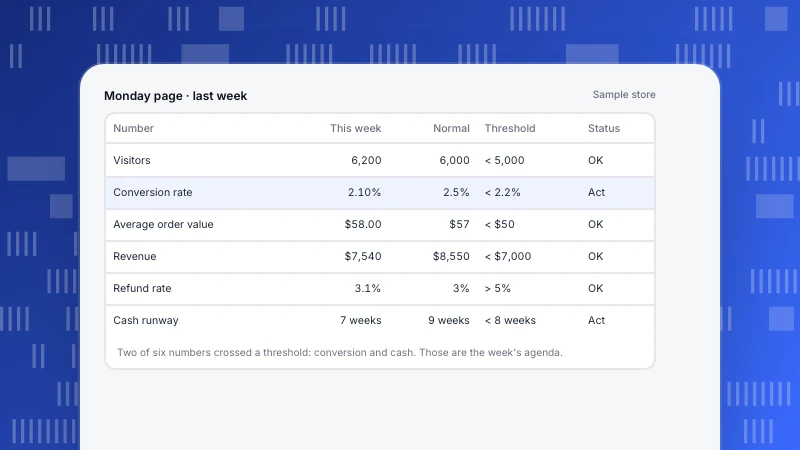
Small business dashboard: 5–7 numbers that tell you when to act
A small business dashboard needs five to seven numbers, each answering whether to act this week. How to pick them, examples for three business types, thresholds and actions, and a worked week.
Read more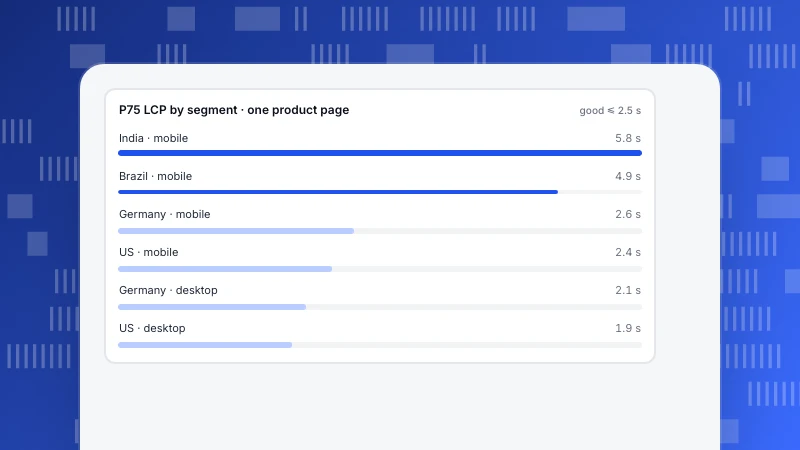
Slow loading websites: find who is slow and where before you fix anything
Why websites load slowly: the server, resource downloads or the browser's main thread. A diagnosis tree, real-user data split by country and device, and the order to fix things in.
Read more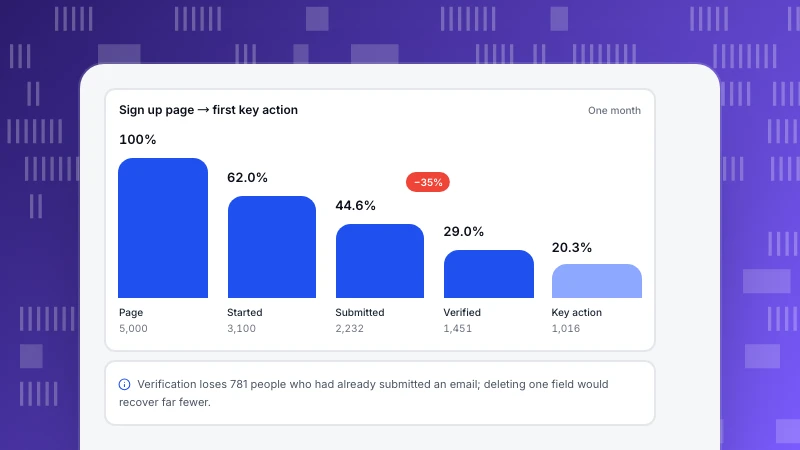
Sign up flow: measure each step before you cut a field
A sign up flow runs from the sign up page to a working account. The trade-off behind each element, a six-event tracking plan, and a worked funnel showing why the step that leaks most is often not the form.
Read more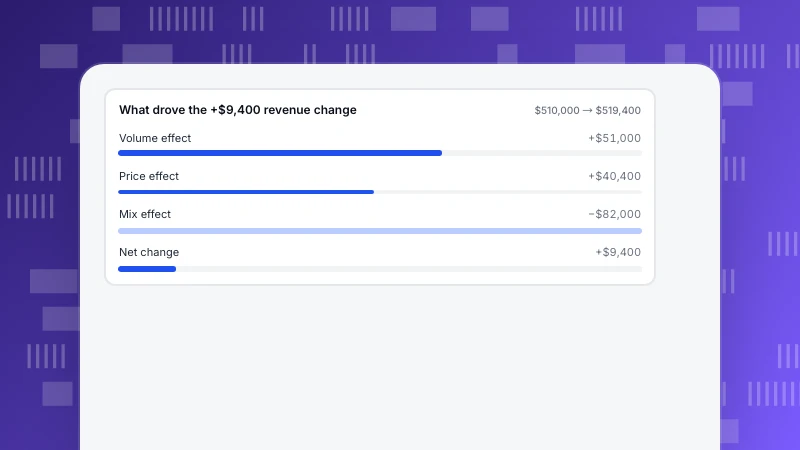
Sales analysis: split revenue into volume, price and mix
Sales analysis explains why revenue changed. Split it into volume, price and mix, or a price increase looks like growth. Types of sales analysis, a worked three-category example, steps and a report structure.
Read more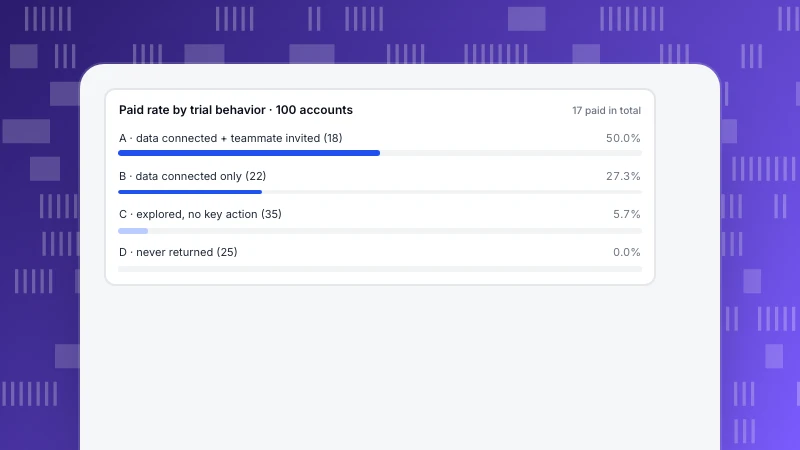
SaaS Lead Generation: Qualify Leads by What They Do in the Product
SaaS lead generation channels compared by lead quality, how to write a behavior-based PQL rule, and a worked example of 100 trials where product behavior predicts payment far better than form fields.
Read more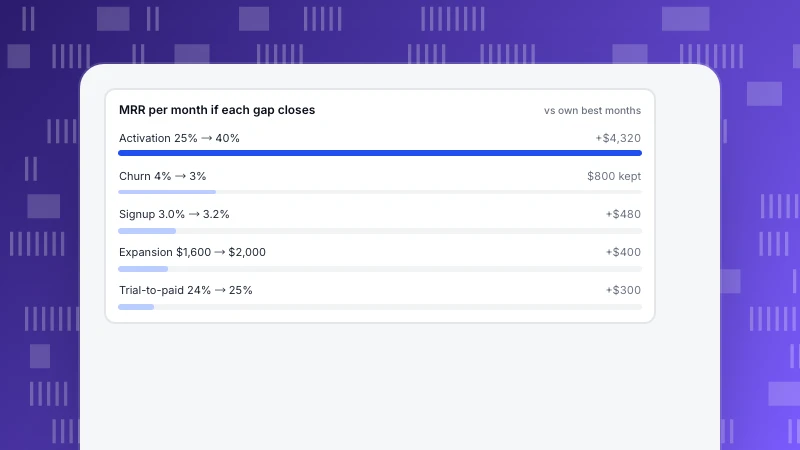
SaaS Growth Strategy: Start From the Stage That Is Most Stuck
Choose a SaaS growth strategy by diagnosis, not by trend: measure each AARRR stage as a rate, convert each gap into MRR, and fix the biggest one first. Worked example, strategies per stage and a quarterly cadence.
Read more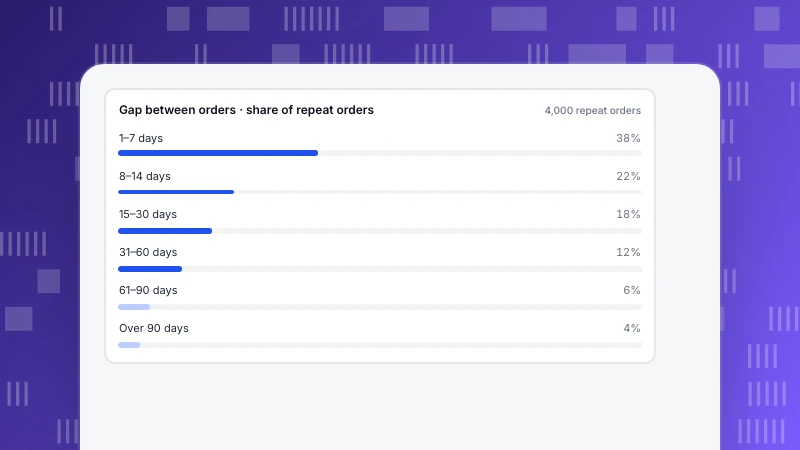
Re-engagement campaign: define dormant before you write the email
A re-engagement campaign brings back customers who went quiet. How to set the dormant window from your own return data, why the wrong window inflates results 30 times, and how to tier, message and measure with a holdout.
Read more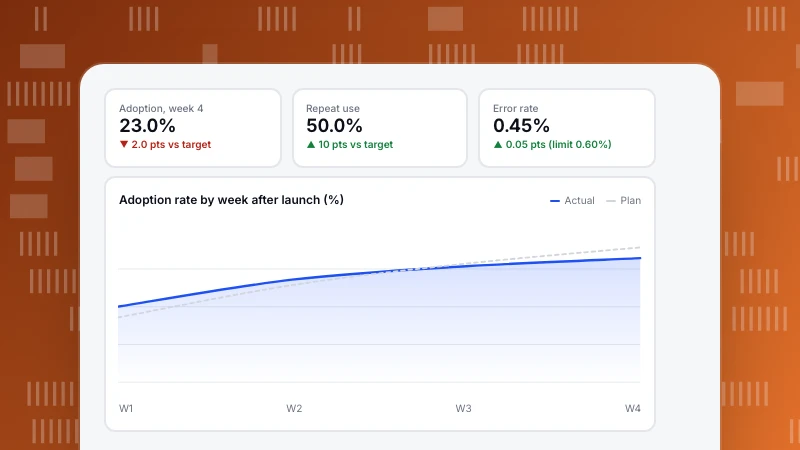
Product launch plan: decide how you will judge success before launch day
A product launch plan covers goals, audience, timeline, roles, rollout and rollback. The part most plans leave vague is how to judge the result. A timeline from six weeks before to four weeks after, a success-criteria card, and a worked review.
Read more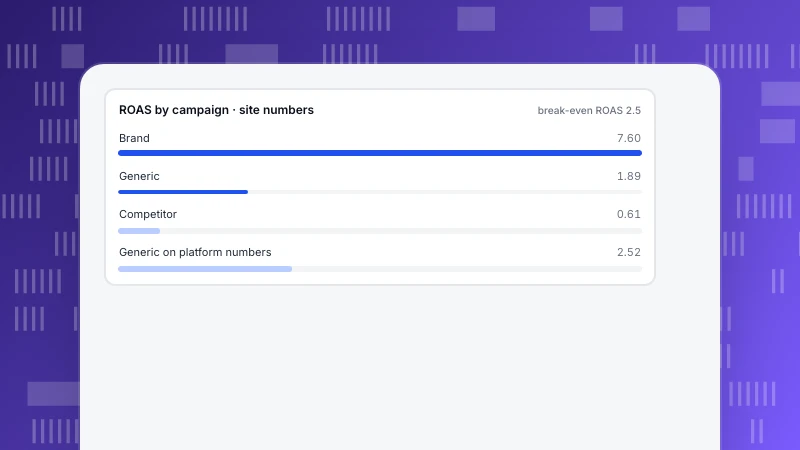
PPC Analysis: Reconcile the Numbers, Then Decide Where Budget Goes
A step-by-step PPC analysis: reconcile platform clicks and conversions with your site's sessions and goals, compare campaigns on CPC, CPA and ROAS against break-even, check landing pages and attribution, then write decision rules.
Read more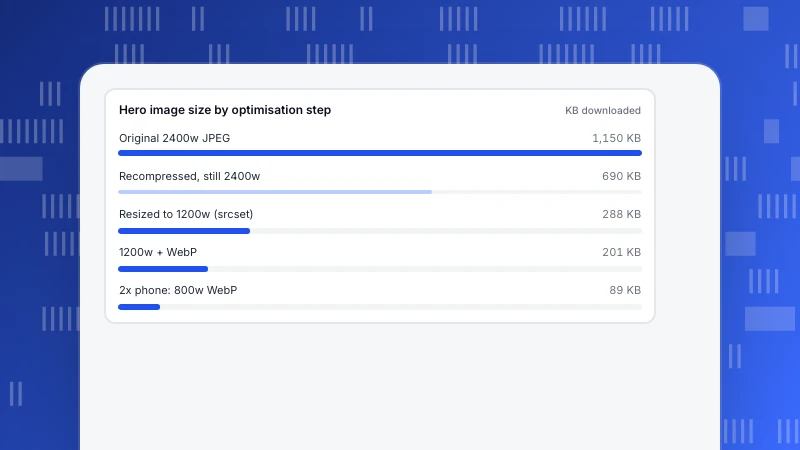
How to optimize images for web: fix size and priority before format
The order that matters when you optimize images for the web: right dimensions with srcset, hero image loaded first, then format and compression. A worked example shows why, plus how to check LCP afterwards.
Read more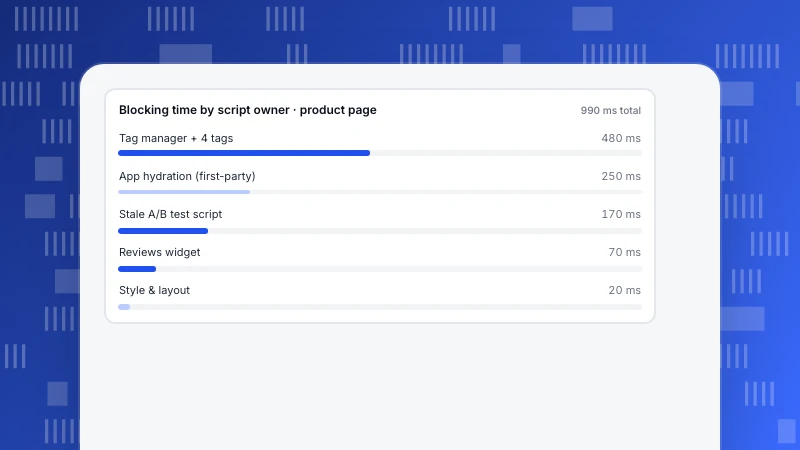
Minimize main thread work: find the long tasks before you fix anything
What Lighthouse's 'minimize main-thread work' audit measures, why it shows up as slow interactions (INP), how to attribute long tasks to the scripts that own them, and which fixes pay off first.
Read more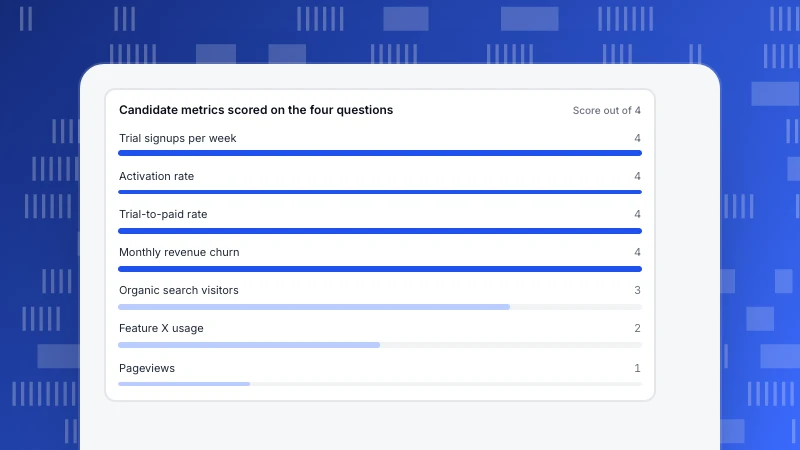
Difference between metrics and KPIs: four questions that decide
Every KPI is a metric, but only a metric with a target, one owner and a threshold that triggers action is a KPI. Four questions, a worked 12-to-4 shortlist and how to calculate an alert threshold.
Read more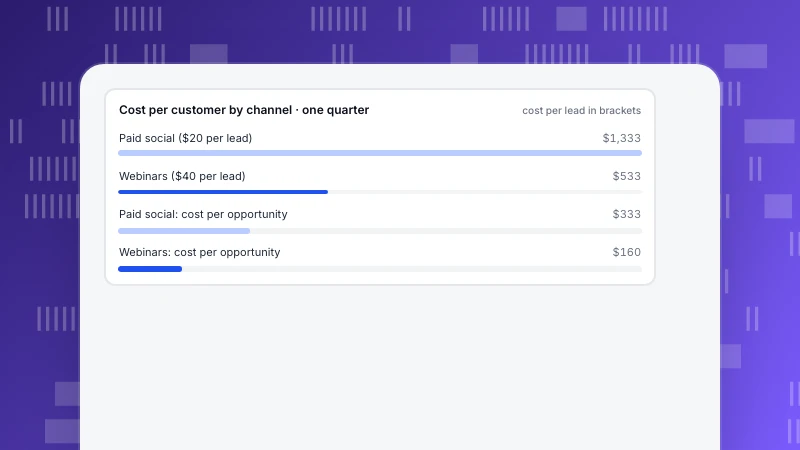
Lead Generation Metrics: Read Them in Pairs, Not Alone
The lead generation metrics that matter in four groups — volume, quality, cost and speed — why each should be read next to a partner metric, and a two-channel example where optimising cost per lead cuts customers by more than a third.
Read moreFive categories, one question each
Each category answers a recurring question we hear from customers. Start with the one closest to your job.
Analytics
Definitions, funnels, retention and the data-quality questions behind every number.
304 articlesGrowth & Marketing
Acquisition, marketing, site and app operations, and how to pick the one stage worth fixing first.
238 articlesLive Chat
Proactive invites, translation and turning support conversations into conversions.
78 articlesAI Search
GPTBot, ClaudeBot, PerplexityBot: who fetches your pages, what the files say and what comes back.
39 articlesProduct News
What shipped, why we built it that way, and how to turn it on.
64 articles