Try it on your own data
Every report in this article is in the free plan. One snippet for web and apps, up to 10 sites.
Start freeLive chat analytics is measuring your chat operation (volume, first response, resolution, satisfaction, missed chats) together with what those visitors did on your site. This guide covers the metrics worth tracking, why chat reports alone mislead, and how putting chat and website data on one dataset shows which pages cause questions and whether chatters reach your goal.
What you will learn
- Track volume against traffic, median first human response, resolution as resolved over all conversations, and missed chats separately; average alone hides slow and unanswered chats.
- Chat reports describe only the visitors who chose to talk. Add the page, source and goal to each chat to find pages that generate questions.
- Chatted-versus-not conversion is observational and self-selected, not an A/B test: use the trend and the page list, not the lift as proof.
What is live chat analytics?
Live chat analytics is the measurement of your chat operation (how many conversations, how fast agents reply, how many get resolved, how satisfied people are) together with what those visitors did on your site. Chat reports alone tell you how busy the team was. Chat plus website data tells you whether chat helps visitors reach a goal.
Most teams stop at the first half. A chat dashboard with a first-response time and a satisfaction score is useful for running a queue, but it cannot say which page raised the question, where the visitor came from, or whether people who chatted went on to buy. This guide covers the live chat metrics worth tracking, the traps in each, and how to add the website side so chat conversion tracking becomes a real comparison instead of a guess.
Which live chat metrics actually matter?
Five numbers cover most decisions: conversation volume, first response time, resolution rate, satisfaction, and missed chats. A sixth view, chats by page, is the bridge to the rest of your analytics. Each has a definition that is easy to get subtly wrong, so write the definition down before you compare anything over time.
- Conversation volume. Conversations started in the period. It is a count of conversations, not of visitors or sessions, so do not add it to the session count in your analytics overview. Read it against traffic: 600 chats on 12,000 visitors is a 5.0% chat rate, and that ratio matters more than the raw 600.
- First response time. Seconds from the start of the chat to the first reply by a human agent, averaged. Count only the first human reply. An automated greeting or an AI answer is not a person answering, and including it makes the number look better than the visitor's experience. Report the median next to the average, because one slow chat drags an average a long way (see the sample below).
- Resolution rate. Resolved conversations divided by all conversations in the period. Divide by all of them, not only the ones an agent touched; otherwise unanswered chats vanish from the denominator and the rate rises for free.
- Satisfaction. A rating the visitor gives after the chat. In TapCub it is a 1 to 5 score collected within 24 hours of resolve, one score per conversation. Watch the response rate: if 30% of people rate, the score describes the happiest and angriest 30%, not everyone.
- Missed chats. Chats where nobody replied, plus offline messages left when no one was online. They do not appear in a first-response average (no reply, nothing to time), so a team can post a fast average while visitors wait. Track them as their own number.
- Chats by page. The page where each chat started. This is where chat data turns from an operations report into a content signal.
Benchmarks exist, but treat them as context rather than targets. LiveChat's Customer Service Report gives a global average first response time of 35 seconds and an average satisfaction of 64.2% from rated chats, with data last updated in 2024. Comm100's 2026 Live Chat Benchmark Report covers more than 220 million live chat interactions across 18 industries and reports customer satisfaction holding at 4.1 out of 5. Both are vendor-published figures, and each defines satisfaction differently (a percentage in one, a 1 to 5 average in the other), so the two numbers cannot be compared with each other or with your own. Use them to sanity-check the order of magnitude, not to grade your team.
| Metric | How it is counted | Common trap | Read it with |
|---|---|---|---|
| Conversation volume | Conversations started in the period (not sessions) | Adding it to the analytics session count | Chat rate: conversations ÷ visitors |
| First response time | Seconds to the first human agent reply, averaged; AI replies excluded | Average hides one slow chat; unanswered chats are left out | Median next to the average |
| Resolution rate | Resolved ÷ all conversations | Dividing by handled chats only | Missed chats counted separately |
| Satisfaction | 1 to 5 score within 24 hours of resolve, one per conversation | Low response rate shows only the extremes | Number of ratings beside the score |
| Missed chats | No agent reply, plus offline messages (counted on their own) | Fast average while visitors wait unseen | Chats by hour against office hours |
| Chats by page | Page where the chat started, no query string, top 10 | Treating it as an ops number only | Page conversion before and after the fix |
Definitions follow the TapCub chat reports. Whatever tool you use, write the definition down before comparing months.
Why do chat reports alone mislead?
Chat reports describe the conversations that happened, not the visitors who needed one and never opened the widget. Three problems follow.
You only see people who chose to talk. Visitors who chat are a self-selected group: often further along, more motivated, or stuck on a specific question. A satisfaction score or resolution rate tells you how the team handled them, not whether chat changed what they did.
Speed metrics hide what is missing. An average that excludes unanswered chats looks healthy while the unanswered ones go unrecorded as a problem. Zendesk's CX Trends 2026 release, from a survey of more than 11,000 people in 22 countries fielded in June 2025, reports that 86% of consumers say responsiveness and accurate resolution strongly influence purchases, and 85% of CX leaders say customers will drop brands that cannot resolve issues on first contact. It is a vendor survey and says nothing about chat specifically, but it supports a practical point: the chats nobody answered are where the cost sits.
A chat has no context. "How long is delivery?" is a different problem from "does this work with my plan?", and the dashboard cannot tell them apart without the page, the source and the visit history. Operations metrics tell you to hire; page-level data tells you to fix a page.
The answer is not to distrust chat data but to put it on the same footing as the rest of your analytics, so each chat has a page, a source, a country and a path behind it.
What changes when chat and website analytics share one dataset?
When both run on the same visitor ID, each chat is attached to the visit that produced it, and you can ask questions a standalone chat tool cannot answer.
- Which page did the chat start on? The page, without its query string, where the visitor opened the conversation. A ranked list of those pages is a list of places where your site fails to answer a question.
- Where did the visitor come from, and what did they do? Source, country, landing page and recent browsing are visible next to the conversation, so an agent answers with context, and you can ask whether chats from one channel or country look different.
- Did visitors who chatted reach your goal more often than those who did not? The comparison that turns chat into chat conversion tracking.
- Which pages generate questions you should answer in the page itself? Fix those, and the chats about them should fall while conversion on that page holds or rises.
- When should the chat speak first? Proactive invites that trigger on a page and a dwell time you choose, so a visitor lingering on the shipping page gets a relevant line without a wall of pop-ups.
This is observational, and it is worth saying plainly. Visitors who chat are self-selected, so a higher conversion among chatters does not prove chat caused it. It is not an A/B test, and TapCub does no traffic splitting. What it does give you is a consistent, same-day comparison to track over time and a ranked list of pages to investigate. For the wider case, see does live chat increase conversions.
What does the full workflow look like with numbers?
Sample data, invented for illustration and recomputed below: a store with 12,000 visitors in a month and a purchase goal.
Operations side (600 conversations):
- Chat rate: 600 ÷ 12,000 = 5.0% of visitors.
- Resolution rate: 480 resolved ÷ 600 conversations = 80.0%.
- Missed: 60 of the 600 conversations never got an agent reply: 60 ÷ 600 = 10.0%. They are left out of the first-response average, so the average describes only the other 540.
- Satisfaction: 150 people rated (150 ÷ 480 = 31.3% of resolved). Scores: 80 fives, 45 fours, 15 threes, 6 twos, 4 ones. Sum = 400 + 180 + 45 + 12 + 4 = 641; 641 ÷ 150 = 4.3.
- Average vs median: take five chats answered in 10, 12, 15, 20 and 300 seconds. Average = 357 ÷ 5 = 71.4 s; median = 15 s. One slow chat moved the average by a factor of nearly five, which is why you read both.
Website side (goal reached that day):
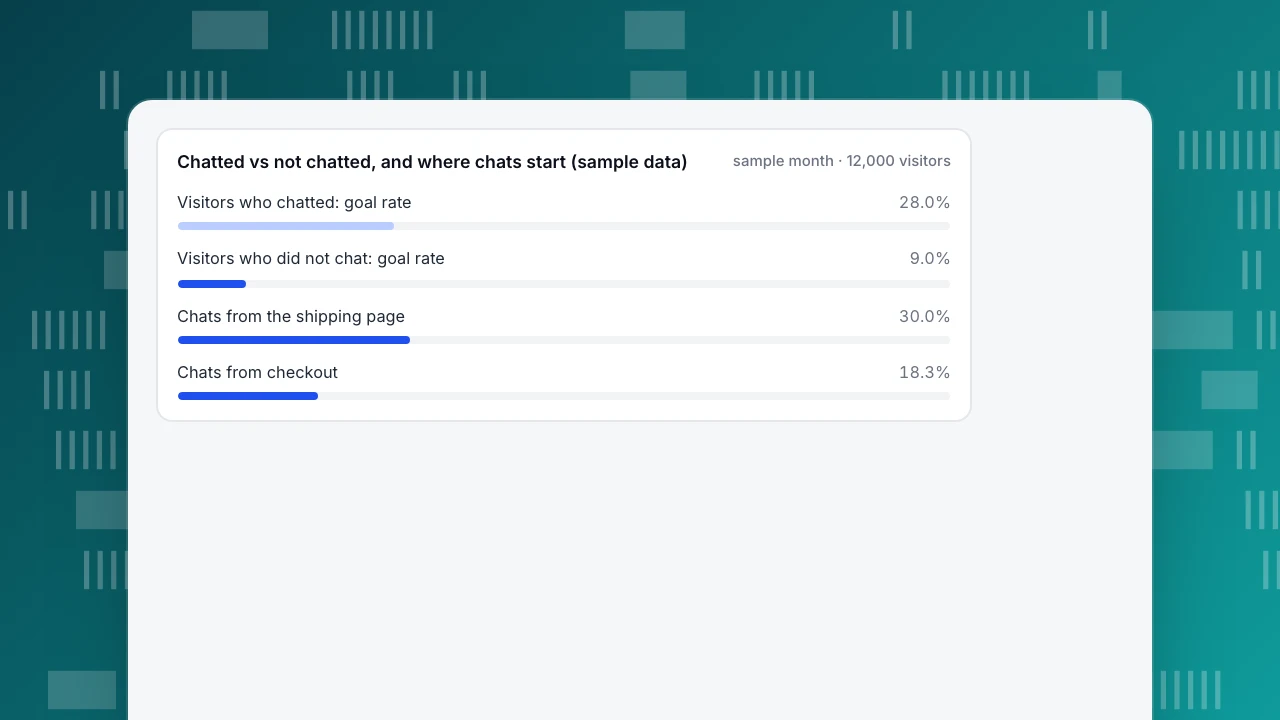
- Visitors who chatted: 168 of 600 reached the goal = 28.0%.
- Visitors who did not chat: 1,026 of 11,400 reached the goal = 9.0%.
- Totals reconcile: 600 + 11,400 = 12,000 visitors; 168 + 1,026 = 1,194 goal completions = 9.95% overall.
- Relative lift: 28.0 ÷ 9.0 − 1 = +211%.
Read that gap carefully. The chatters are the people with a question and intent to act, so most of the gap is selection. The useful number is not the lift but the trend: if it collapses after a site change, something broke.
Chats by page (600 chats):
| Page where the chat started | Chats | Share |
|---|---|---|
| Shipping and delivery page | 180 | 30.0% |
| Product pages | 150 | 25.0% |
| Checkout | 110 | 18.3% |
| Returns page | 90 | 15.0% |
| Everything else | 70 | 11.7% |
Two reading points. The shipping page generating 30% of chats is odd: it exists to answer shipping questions and still produces them, so it is probably unclear or missing a delivery-date table. And the 110 chats from checkout are high-intent questions at the moment of payment. The fix is to answer both on the page. Add a delivery-time table to the shipping page and a one-line returns summary next to the payment button, then watch the chat count from those pages and the goal rate over the next month. If chats from those pages fall and the goal rate holds, you removed friction; the agents' time moves to harder questions. The placement logic behind these fixes is in ecommerce trust signals.
Chatted vs not chatted, and where chats start (sample data)
sample month · 12,000 visitorsHow do you set this up in TapCub?
Chat and analytics use the same script and the same visitor ID, so there is no second integration. The steps use the menu names in the console:
- Turn chat on. Enable live chat in Live chat › Chat settings and invite an agent in Live chat › Agents. The setup is in enable live chat.
- Add a goal first. In Web analytics › Goals, define a goal such as the order-complete page. Without a goal, the chat-versus-no-chat comparison stays at 0.
- Read the operations numbers. Live chat › Reports › Overview shows conversations, resolution rate (resolved divided by conversations), average and median first response (first human reply only, AI replies excluded), the 1 to 5 satisfaction score, agent workload, offline messages counted separately, a weekday-by-hour heatmap and the top 10 pages where chats started. Ranges follow the site timezone. Agent-only members see only their own handling by default.
- Read the comparison. Live chat › Reports › Conversion attribution compares visitors who chatted and reached a goal that day with those who browsed without chatting, gives the relative lift, and lists hot pages. When fewer than 30 visitors chatted, the page says the sample is too small to rely on. The join works within one calendar day, so on the strict privacy preset (where the visitor ID rotates daily) an order on a later day is not counted as a goal after chat.
- Look at the visitor behind a chat. In Live chat › Inbox, the visitor drawer shows region, device, referrer, landing page and current page, the pages viewed during the chat, a 2-day analytics trail, and View in analytics for the full profile.
- Add proactive invites where the questions are. In Live chat › Chat settings › Proactive invites, a rule matches a page (every page, path contains, prefix or regex) and a dwell time from 3 to 600 seconds, with invite text up to 300 characters. Only the highest-priority matching rule fires, and nothing about the invite is written into the visitor's browser. The rule list records impressions, open rate and reply rate, so you can retire lines nobody answers. Rule limits depend on your plan; the Free plan has one rule. Invites are a trigger on page and dwell only, so they cannot target by visitor segment or behaviour.
Boundaries: TapCub does not run A/B tests, so chat conversion is observational. Conversation counts are not analytics sessions. Conversations are deleted on the retention schedule you set in privacy settings, so export anything you need to keep beyond it. For the AI side of chat, see AI live chat; for the product overview, live chat.
FAQ
What is live chat analytics?
Live chat analytics measures your chat operation (volume, first response time, resolution rate, satisfaction, missed chats) and, in a combined tool, ties each chat to the page, source and behaviour of the visitor behind it. The operations half shows how the team performed; the website half shows which pages cause questions and whether chatters reach your goal.
Which live chat metrics should I track first?
Start with conversation volume against traffic, median first human response, resolution rate, and missed chats. Add satisfaction once enough people rate to mean something, and add chats by page as soon as your chat tool can show it. Define each metric in writing so the numbers stay comparable month to month.
How do I measure chat conversion?
Set a goal in your analytics, then compare the share of visitors who chatted and reached it with the share of non-chatters who did, on the same day. Expect chatters to convert more because they are self-selected. Treat the gap as a trend to monitor, not proof of cause, and require a reasonable sample size.
What is a good first response time for live chat?
It depends on how you define it and who you serve. LiveChat reports a 35-second global average from its own customers (data last updated 2024), but its definition and customer mix are its own. Compare against your own median over time, count only the first human reply, and track unanswered chats separately.
How do I find which pages generate chats?
Look at the page where each chat started, ranked by count. In TapCub the Overview report lists the top 10 pages and Conversion attribution lists hot pages, without query strings. A page with many chats usually has an unanswered question. Add the answer to the page, then watch whether chats from it fall.
Do proactive chat invites help?
They can, if the trigger matches a real hesitation, such as a visitor staying 30 seconds on a shipping page. Measure impressions, open rate and reply rate per rule, and retire lines nobody answers. Invites trigger on page and dwell time only, and you cannot test them against a control group in TapCub, so judge them by reply rate.
See also: live chat for ecommerce and live chat support software.
See also: Best Live Chat Software: How to Choose and Compare
Sources
- LiveChat. Customer Service Report — global average first response time 35 seconds ("average time taken by an agent to send the first response") and average satisfaction 64.2% of rated chats; data last updated 2024. Vendor-published statistic. Read 2026-11-21.
- Comm100. 2026 Live Chat Benchmark Report — more than 220 million live chat interactions across 18 industries; customer satisfaction held at 4.1 out of 5. Vendor-published statistic. Read 2026-11-21.
- Zendesk. Contextual intelligence becomes the new standard for exceptional customer experience in 2026 (press release, 2025-11-18; CX Trends 2026) — 11,000+ respondents in 22 countries, fielded June 2025; 86% of consumers say responsiveness and accurate resolution strongly influence purchases; 85% of CX leaders say customers will drop brands that cannot resolve issues on first contact. Vendor-run survey; no chat-specific figures. Read 2026-11-21.
Was this article helpful?
We use your answers to fix and expand this page.
Couldn’t send. Please try again in a minute.
Thanks for the feedback. We’ll use it to improve this page.You’ve already sent feedback on this page. Thanks.

Data Engineer
Writes about event design, data quality, and collection workflows, with verifiable implementation methods for reliable analytics.