Try it on your own data
Every report in this article is in the free plan. One snippet for web and apps, up to 10 sites.
Start freeTo create a dashboard, start from decisions rather than data: name the audience, turn each decision into a question, give each question one metric with a written formula, choose a bar, line or number tile, and lay the tiles on one screen by importance. The example builds a six-tile marketing dashboard whose numbers reconcile: 48,000 sessions, 1,200 conversions, and a $33.33 against $20.00 cost per conversion that points to one decision.
What you will learn
- Every tile must answer a question someone will act on; if a question would change no decision, leave it off
- Write the formula for each metric and check the totals: 1,200 ÷ 48,000 = 2.50%, not the 2.36% average of channel rates
- Keep it to one screen, order tiles by decision, and prune after review with the person it is for
What a dashboard is for, and what it is not
A dashboard is a way to monitor, not a place to explore. Stephen Few's 2004 definition, from his article "Dashboard Confusion", begins: "a visual display of the most important information needed to achieve one or more objectives", consolidated on a single screen so it can be monitored at a glance. In 2017 he gave a revised version: "a predominantly visual information display that people use to rapidly monitor current conditions". Nielsen Norman Group makes the same point in practical terms: dashboards are focused on a single task, communicating critical information, and their goal is not to facilitate exploration.
Two rules follow, and most failed dashboards break one of them:
- One audience, one set of decisions. A dashboard for the person who allocates ad budget is not the dashboard for the person who fixes the website.
- Every tile answers a question that someone will act on. A tile nobody can act on is decoration.
NN/g's guidance gives no maximum number of tiles, so any number you hear is a rule of thumb. This guide uses six because six questions is what the example's owner needs to make weekly decisions; your number is whatever fits one screen without scrolling. For ready-made layouts by role, see analytics dashboard and KPI dashboard; this guide covers the process that gets you from a blank page to one of them.
The six steps from question to layout
| Step | What you do | Output |
|---|---|---|
| 1 | Name the audience and the decisions they make | One sentence per decision |
| 2 | Turn each decision into a question | A numbered question list |
| 3 | Pick one metric per question and write its formula | Metric definitions |
| 4 | Choose a chart type that fits the comparison | Chart per tile |
| 5 | Lay out the tiles by importance on one screen | A sketch |
| 6 | Add comparison, review with the audience and prune | The first version |
The next sections walk through all six on one example.
Steps 1 and 2: audience and questions
The audience in the example is a marketing manager who reviews the site every Monday and decides three things: whether to shift budget between channels, which landing page to fix first, and whether anything is broken. Written as questions:
- Is traffic growing compared with the previous period?
- Which channels send the traffic?
- Which channels convert?
- What does a conversion cost on the paid channels?
- Which landing pages lose visitors?
- Is anything slow or broken for real visitors?
Six questions, six tiles. If a seventh question appears, the test is: which decision would it change? If none, leave it out. If someone wants a "nice to have" tile, put it on a second, analytical dashboard rather than crowding this one.
Steps 3 and 4: the metric and the chart for each question
Give each question one metric and write its formula down, so nobody argues later about what a number means. Then pick the chart for the comparison. NN/g recommends encoding quantities with length and position, in bar charts, line charts and scatterplots, and avoiding pie charts, donuts, radial gauges and 3D, and not using colour alone to show magnitude (about 4.5% of people have some colour blindness).
| # | Question | Metric and formula | Chart | Compared with |
|---|---|---|---|---|
| 1 | Is traffic growing? | Sessions | Big number with line | Previous period |
| 2 | Where does it come from? | Sessions by channel | Horizontal bars | Previous period |
| 3 | Which channels convert? | Conversions ÷ sessions, by channel | Table with bars | Previous period |
| 4 | What does a conversion cost? | Spend ÷ conversions, paid channels | Horizontal bars | Target cost |
| 5 | Which landing pages leak? | Bounce rate of entry sessions, by entry page | Sorted table | Sitewide rate |
| 6 | Anything broken? | P75 LCP and error rate | Two numbers with threshold | 2.5 s target |
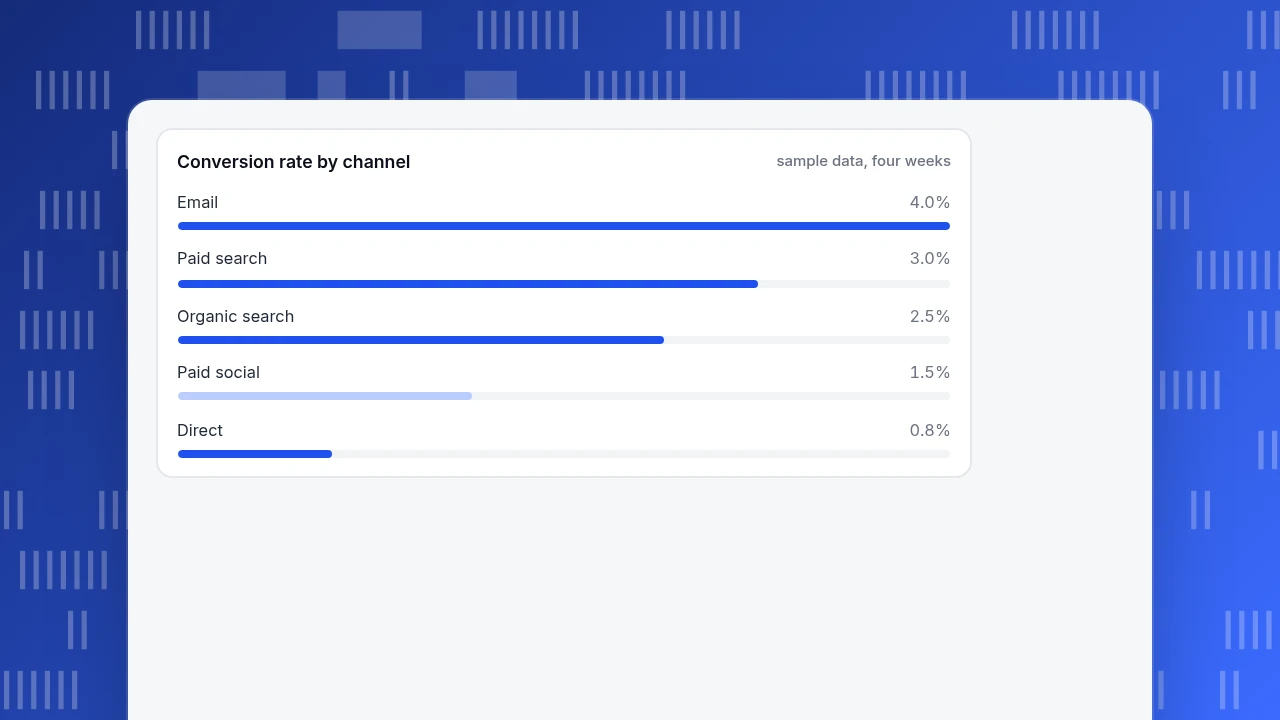
Now put numbers in to see whether the tiles tell a story. Sample data for a four-week period against the previous four weeks.
| Channel | Sessions | Conversions | Conversion rate | Spend | Cost per conversion |
|---|---|---|---|---|---|
| Organic search | 19,200 | 480 | 2.5% | ||
| Paid search | 12,000 | 360 | 3.0% | $7,200 | $20.00 |
| 6,000 | 240 | 4.0% | |||
| Paid social | 4,800 | 72 | 1.5% | $2,400 | $33.33 |
| Direct | 6,000 | 48 | 0.8% | ||
| Total | 48,000 | 1,200 | 2.50% | $9,600 |
Check the arithmetic. Sessions: 19,200 + 12,000 + 6,000 + 4,800 + 6,000 = 48,000. Conversions: 480 + 360 + 240 + 72 + 48 = 1,200. Total rate 1,200 ÷ 48,000 = 2.50%, which is not the average of the five channel rates (2.36%) because the channels have different traffic. Cost per conversion: $7,200 ÷ 360 = $20.00 and $2,400 ÷ 72 = $33.33. The previous period had 45,000 sessions and 1,080 conversions (2.40%), so sessions grew 48,000 ÷ 45,000 − 1 = 6.7% and conversions 1,200 ÷ 1,080 − 1 = 11.1%.
The story the tiles tell: traffic is up 6.7% and conversions up 11.1%; paid social costs 67% more per conversion than paid search ($33.33 against $20.00) and converts at half the rate (1.5% against 3.0%); so the decision for Monday is to look at moving paid social budget, which is exactly the decision the audience owns.
Conversion rate by channel
sample data, four weeksStep 5: lay out the tiles on one screen
Put the most important information where the eye lands first, the top left, and group tiles that answer related questions. For the example:
| Row | Left | Right |
|---|---|---|
| Top | 1. Sessions with change vs previous period | 3. Conversion rate with change |
| Middle | 2. Sessions by channel | 4. Cost per conversion, paid channels |
| Bottom | 5. Entry pages ranked by bounce | 6. LCP and error rate vs target |
The top row is the headline, the middle row is "where to shift money", the bottom row is "what to fix". Reading order matches decision order. Keep the whole thing on one screen: Few's definition says single screen, and NN/g says dashboards should fit a single-screen view. If you must scroll, you have two dashboards.
Three layout rules that earn their keep:
- Use the same scale and order across tiles so channels appear in the same sequence everywhere.
- Label each tile with the question or the metric name and the period. "Sessions, last 28 days vs previous 28" beats "Traffic".
- Show change as a number and a direction, not only as colour.
| Row | Left | Right |
|---|---|---|
| Top | 1. Sessions with change vs previous period | 3. Conversion rate with change |
| Middle | 2. Sessions by channel | 4. Cost per conversion, paid channels |
| Bottom | 5. Entry pages ranked by bounce | 6. LCP and error rate vs target |
The top row is the headline, the middle is where to shift money, the bottom is what to fix.
Step 6: review with the audience and prune
Show the first version to the person it is for, and ask three questions: What would you do differently on seeing this? Which tile did you not look at? What did you look for that is not here? Remove the tile no one used, and add only what changes a decision. Repeat after two weeks.
Two checks catch the usual faults. First, if the same number appears with different values on two tiles, a definition differs: fix the formula, not the tile. Second, if a tile never changes a decision, remove it even if it looks good. A dashboard that is pruned every quarter stays useful; one that only grows becomes a report nobody reads.
How to build this dashboard in TapCub
Here is how the six-tile example maps onto TapCub. A TapCub dashboard is a board of saved analyses, so you build the tiles first and then arrange them.
- Create the tile analyses. Build tiles 1 to 3 and 5 in All-platform analytics › Behavior › Behavior analysis: sessions, sessions by channel, conversion rate by channel (using a goal from Web analytics › Goals) and entry-page bounce. Save each one with a name and description. Saving needs the analyst role or above.
- Bring in the spend. For tile 4, import daily spend per channel, source and campaign into All-platform analytics › Business › Channel ROI (CSV or entry by entry). TapCub computes cost per click (spend ÷ sessions) and cost per acquisition (spend ÷ purchases in orders) grouped by channel, source or campaign. This page is separate from saved analyses, so keep it open beside the board unless a saved analysis can express the same figure.
- Check speed and errors for tile 6. Real-visitor LCP at P75 with the 2.5 and 4 second thresholds is in Monitoring › Performance; error rate (errors ÷ page views) is in Monitoring › Errors.
- Assemble the board. In All-platform analytics › Overview › My dashboards, add the saved analyses as cards, add a text card for the question or period, and use dividers to separate the three rows. The board has its own date range and filters; leave the identity unchanged and each card keeps its own. Make it the default dashboard, and pin it to the sidebar of the web shell so it opens already filtered to the website.
- Share it read-only. A board can be shared by a read-only link, with an optional password, showing at most the last 90 days. Opening and closing sharing needs the admin or owner role; viewers cannot change parameters.
TapCub does not decide which tile to act on; the questions and the decisions stay with you. If you want a notification instead of a weekly look, alert rules for a metric are set separately in All-platform analytics › Operations › Monitors.
FAQ
How do I create a dashboard?
Start from the decisions, not the data. Name the audience, turn each decision into a question, give each question one metric with a written formula, choose a bar, line or number tile, lay the tiles on one screen by importance, and prune after review. The example used six tiles.
How many charts should a dashboard have?
There is no research-backed maximum; NN/g gives no number. Use as many as the audience has decisions, and keep them on one screen without scrolling. The example uses six. If you need more, build a second dashboard for a different audience or purpose.
What chart types work best on a dashboard?
Bar charts, line charts and tables for comparing quantities; big numbers with a change indicator for headlines. NN/g advises avoiding pie and donut charts, radial gauges and 3D, and not relying on colour alone to show magnitude.
What is the difference between a dashboard and a report?
A dashboard is for monitoring at a glance on one screen and prompting a decision; a report explains something in depth and may run to many pages. Few's definition stresses rapid monitoring of current conditions.
How often should I update a dashboard?
Refresh the data at the rhythm of the decision: daily for operations, weekly for a Monday marketing review. Review the design itself every quarter, removing tiles that no longer change a decision.
Sources
- Stephen Few, Perceptual Edge. There's Nothing Mere About Semantics (December 13, 2017): the 2004 definition from "Dashboard Confusion" and the revised definition. Checked 2026-11-20.
- Page Laubheimer, Nielsen Norman Group. Dashboards: Making Charts and Graphs Easier to Understand (June 18, 2017): single task, single screen, chart choice, colour. Checked 2026-11-20.
Was this article helpful?
We use your answers to fix and expand this page.
Couldn’t send. Please try again in a minute.
Thanks for the feedback. We’ll use it to improve this page.You’ve already sent feedback on this page. Thanks.

Data Analyst
Explores traffic sources, conversion funnels, and retention, using clear metric definitions and concrete examples to explain what the numbers mean.