Try it on your own data
Every report in this article is in the free plan. One snippet for web and apps, up to 10 sites.
Start freeAn email marketing dashboard should answer whether recent sends made money without hurting sender reputation, in three layers: delivery health on top, engagement (clicks, not opens) in the middle, and outcomes from website analytics at the bottom, led by revenue per 1,000 sends. Below: why opens mislead, spam thresholds, UTM tagging and a worked example.
What you will learn
- Stack the board as delivery health, then engagement, then outcomes, so a delivery problem is seen before you read anything below it
- Use click rate instead of open rate: Apple's Mail Privacy Protection downloads content in the background whether or not the email is read
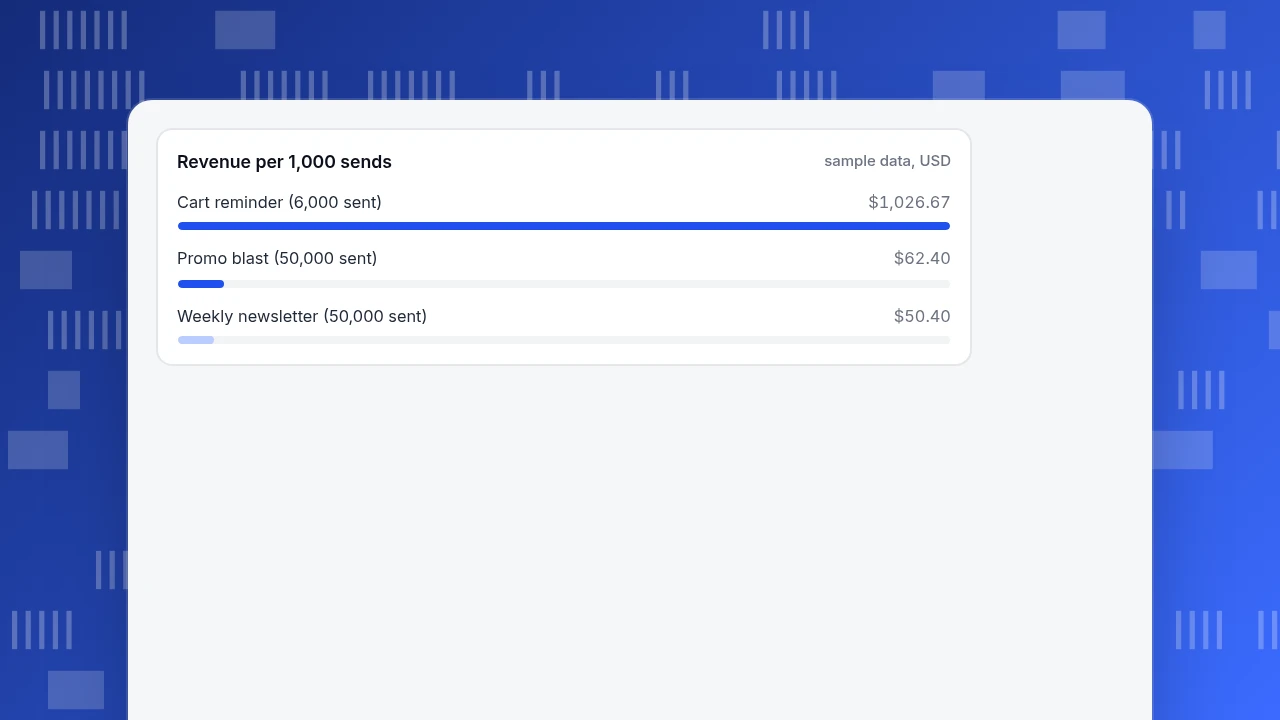
- Compare sends by revenue per 1,000 sends: in the example a 6,000-person cart reminder earns 20 times a 50,000-person newsletter per 1,000 sends
What belongs on an email marketing dashboard, and in what order?
An email marketing dashboard should answer one question every time someone opens it: did the last sends make money without hurting the sender's reputation? That question needs three layers, stacked in this order so a problem in an upper layer is seen before you read the lower ones:
- Delivery health (top). Delivered rate, complaint (spam) rate and unsubscribe rate. If these are bad, nothing below matters, because mail is not arriving.
- Engagement (middle). Clicks and click rate. This is the layer where open rate usually sits, and the next section explains why it should not carry the weight.
- Outcomes (bottom). Sessions from the email, conversions, orders, revenue and revenue per send. These come from your website analytics, not from the email tool.
| Metric | Formula | Where the data lives | How far to trust it |
|---|---|---|---|
| Delivered rate | delivered ÷ sent | Email tool | High |
| Complaint rate | complaints ÷ delivered | Email tool, mailbox provider tools | High, but see the thresholds below |
| Click rate | clicks ÷ delivered | Email tool | Medium: can include automated clicks |
| Open rate | opens ÷ delivered | Email tool | Low: inflated by privacy features |
| Sessions from email | visits tagged with email UTMs | Website analytics | High if tagging is consistent |
| Conversion rate | orders ÷ sessions from email | Website analytics | High |
| Revenue per 1,000 sends | revenue ÷ sends × 1,000 | Website analytics and email tool | High, comparable across campaigns |
Put revenue per 1,000 sends in the biggest type. It is the only number that compares a 50,000-person newsletter with a 6,000-person cart reminder on the same footing. For the wider picture of channels beyond email, see marketing dashboard; for how to tag and follow a single email, see email campaign tracking.
Why is open rate a weak number on a dashboard?
Open rates are counted when an image in the email is downloaded, and some mail apps now download it automatically. Apple's Mail Privacy Protection "downloads remote content in the background by default" regardless of whether the person engages with the email, and sends it through two relays so that no single party can tie your IP address to the content (Apple). A message can therefore be counted as opened on a device whose owner never read it.
A worked example shows the size of the distortion. Sample data: a list of 49,100 delivered addresses, of which 40% (19,640) use an app that pre-downloads images, and where 18% of the other 29,460 genuinely open.
- Pre-downloaded opens: all 19,640 are recorded as opens.
- Real opens among the rest: 29,460 × 18% = 5,303.
- Reported opens: 19,640 + 5,303 = 24,943, a 50.8% open rate.
- The real open rate among people who can be measured: 18%.
The number on the dashboard (50.8%) is nearly three times the 18% rate among people who can be measured. The 40% share is an assumption for the example; the point is that you do not know the true share in your own list. Use click rate for engagement and treat opens as a rough signal for subject-line tests between two sends to the same list, where the distortion applies equally.
What delivery thresholds should the top row watch?
Mailbox providers publish limits, and the top row should be coloured against them. Google's requirements for senders to Gmail apply once you send more than 5,000 messages a day, and ask you to keep the spam rate in Google Postmaster Tools below 0.30%, advising that you aim for below 0.10% and avoid ever reaching 0.30%. Marketing messages must support one-click unsubscribe and carry a visible unsubscribe link (Google Workspace Admin Help).
On the sample list, those thresholds translate into counts:
| Threshold | On 49,100 delivered | Meaning |
|---|---|---|
| 0.10% spam rate | 49 complaints | Target; stay below it |
| 0.30% spam rate | 147 complaints | Limit; do not reach it |
Colour the complaint tile green below 0.10%, amber between 0.10% and 0.30% and red above. If the tile turns amber, pause a segment rather than finishing the campaign: the likely cause is an old or purchased list, and an extra email makes it worse.
| Threshold (Google, Gmail senders) | On 49,100 delivered | What to do |
|---|---|---|
| Spam rate 0.10% | 49 complaints | Target: stay below it |
| Spam rate 0.30% | 147 complaints | Limit: never reach it; pause a segment well before |
| More than 5,000 messages a day to Gmail | n/a | Bulk-sender rules apply, including one-click unsubscribe |
From Google's email sender guidelines (checked 2026-11-20): spam rate in Postmaster Tools below 0.30%, aim for below 0.10%.
Worked example: revenue per 1,000 sends
Sample data: three sends in one month. Clicks come from the email tool, while sessions, orders and revenue come from website analytics filtered to each campaign's UTM tag.
| Send | Sent | Delivered | Clicks | Click rate | Sessions | Orders | Conversion | Revenue | Revenue per 1,000 sends |
|---|---|---|---|---|---|---|---|---|---|
| Weekly newsletter | 50,000 | 49,100 | 1,450 | 2.95% | 1,190 | 36 | 3.03% | $2,520 | $50.40 |
| Cart reminder | 6,000 | 5,950 | 720 | 12.1% | 655 | 88 | 13.44% | $6,160 | $1,026.67 |
| Promo blast | 50,000 | 49,000 | 3,050 | 6.22% | 2,380 | 52 | 2.18% | $3,120 | $62.40 |
Check one row: for the promo blast, 3,050 ÷ 49,000 = 6.22% click rate, 52 ÷ 2,380 = 2.18% conversion, and $3,120 ÷ 50,000 × 1,000 = $62.40 per 1,000 sends. Three readings follow:
- The cart reminder earns about 20 times as much per 1,000 sends. $1,026.67 against $50.40 is 20.4 times, from a send of 6,000 against 50,000. Size of list does not predict value.
- The promo blast has more clicks than the newsletter but a worse conversion (2.18% against 3.03%) and a lower order value ($60 against $70), which suggests the discount pulls in browsers. Revenue per 1,000 sends ($62.40) is only 24% above the newsletter's ($50.40), for twice the clicks.
- Sessions are lower than clicks in every row (82.1%, 91.0% and 78.0% of clicks). A gap is normal: people leave before the page loads, and some clicks are automated. What matters is that the ratio stays stable between sends; a sudden drop means a tagging or tracking problem.
Revenue per 1,000 sends
sample data, USDHow do you tag email links so the dashboard works?
The outcomes layer exists only if every link carries UTM parameters. Google Analytics documents utm_source, utm_medium, utm_campaign and utm_content as the campaign parameters, notes that values are case sensitive ("Meta" and "meta" are separate values), recommends lowercase and consistent names, and says that when you set one parameter you should set all relevant ones because missing ones show up as "(not set)" (Google Analytics Help).
A convention that works for email:
| Parameter | Rule | Example |
|---|---|---|
utm_source | The list or programme the email came from | newsletter |
utm_medium | Always the same for email | email |
utm_campaign | One value per send, date first | 2026-11-promo |
utm_content | Which link in the email | hero_button |
Full link: https://example.com/offer?utm_source=newsletter&utm_medium=email&utm_campaign=2026-11-promo&utm_content=hero_button. Write the rule down and generate links from a sheet, not by hand: one Email in a campaign name splits one send into two rows.
What traps make an email dashboard lie?
- Counting opens as engagement. See above; use clicks.
- Comparing sends to different lists. A cart reminder goes to people who just visited; a newsletter goes to everyone. Compare like with like, or compare revenue per 1,000 sends and say which list each used.
- Mixing campaigns and automations. An always-on welcome series will dwarf one-off sends in a monthly total. Show them in separate rows.
- Reading revenue without a comparison. Some of the orders from a reminder would have happened anyway. The honest comparison is against a holdout group that did not receive the email; if you cannot hold one out, report revenue as "attributed", not "caused".
- Ignoring bots in sessions. Automated clicks and visits inflate clicks and sessions; make sure the analytics side filters them.
How to build the email dashboard from your analytics in TapCub
TapCub does not send email or count opens and clicks; those stay in your email tool. It supplies the outcomes layer: sessions, conversions and cost from the same tagged links.
- Tag the links. Use the UTM convention above in every email.
- Read sessions and conversions by campaign. Open Web analytics › Sources and its UTM tab, which splits visitors, sessions, bounce and duration by source, medium, campaign, term and content. The channel table also shows conversions.
- Define the goal. Create the purchase goal under Web analytics › Goals; the same data appears under All-platform analytics › Business › Goals, and selecting a goal limits the breakdowns to it.
- Import the cost of each send. Under All-platform analytics › Business › Channel ROI, import spend by day, channel and campaign (CSV or one by one), and the page gives cost per click (spend ÷ sessions), cost per acquisition (spend ÷ purchases) and return on ad spend, grouped by channel, source or campaign.
- Put it on one board. Save these analyses as cards under All-platform analytics › Overview › My dashboards, and use a text block to note the sends and delivered counts from your email tool, since revenue per 1,000 sends needs them: revenue from TapCub ÷ sends from your email tool × 1,000.
TapCub keeps recognised bots and AI crawlers out of the visitor counts in these reports (Web analytics › Bots), so the sessions in step 2 are people.
FAQ
What should an email marketing dashboard include?
Three layers: delivery health (delivered, complaint and unsubscribe rates), engagement (clicks and click rate) and outcomes (sessions from the email, conversions, revenue and revenue per 1,000 sends). Put delivery health at the top, because nothing below it matters if mail is not arriving.
Is open rate still a useful email metric?
Only as a rough signal. Apple Mail Privacy Protection downloads remote content in the background whether or not the email is opened, so opens can be recorded for people who never read the message. Use click rate and downstream conversions for decisions.
What spam rate is safe for Gmail?
Google asks bulk senders (more than 5,000 messages a day to Gmail) to keep the spam rate in Postmaster Tools below 0.30% and advises aiming for below 0.10%. On 49,100 delivered messages, that is 147 and 49 complaints.
How do I track email revenue in analytics?
Add utm_source, utm_medium and utm_campaign to every link, keep the values lowercase and consistent, and filter your analytics to each campaign's tag. Then divide revenue by the number of sends from your email tool to get revenue per send.
How do I compare a newsletter with a reminder email?
Use revenue per 1,000 sends and note the list each went to. In the example, a cart reminder earned $1,026.67 per 1,000 sends and a newsletter $50.40, because the reminder goes to people who just visited.
Sources
- Apple, "Mail Privacy Protection & Privacy": remote content downloaded in the background regardless of engagement, routed through two relays. https://www.apple.com/legal/privacy/data/en/mail-privacy-protection/ (checked 2026-11-20)
- Google Workspace Admin Help, "Email sender guidelines": more than 5,000 messages a day, spam rate below 0.30% (aim below 0.10%), one-click unsubscribe. https://support.google.com/a/answer/81126 (checked 2026-11-20)
- Google Analytics Help, "Collect campaign data with custom URLs": UTM parameters, case sensitivity, "(not set)". https://support.google.com/analytics/answer/10917952 (checked 2026-11-20)
Was this article helpful?
We use your answers to fix and expand this page.
Couldn’t send. Please try again in a minute.
Thanks for the feedback. We’ll use it to improve this page.You’ve already sent feedback on this page. Thanks.

Data Analyst
Explores traffic sources, conversion funnels, and retention, using clear metric definitions and concrete examples to explain what the numbers mean.