Try it on your own data
Every report in this article is in the free plan. One snippet for web and apps, up to 10 sites.
Start freeEcommerce benchmarks are published averages (conversion rate, cart abandonment) that you compare your store against, and they only work when definition, device mix and period match. Traceable figures: 70.22% cart abandonment (Baymard, 50 studies), 3.4% desktop and 2.0% mobile conversion, and ecommerce at 17.9% of US retail. Below: the sourced table, a device-mix adjustment and one store worked through.
What you will learn
- Compare only like with like: same definition (visitors or sessions), same device mix and same period as the benchmark
- Reweight the benchmark to your device mix: at 55% mobile, 2.0% mobile and 3.4% desktop give an expected 2.63%, not the 2.69% headline
- Use published numbers as a range and your own same-period history as the target
What is an ecommerce benchmark, and when is it safe to compare against one?
An ecommerce benchmark is a published figure for a store metric (conversion rate, cart abandonment, average order value) that you compare your own number against. It is safe to compare only when three things match: the definition (what is divided by what), the mix (device, traffic source, product category) and the period (season, month). Most disappointing comparisons come from a mismatch in one of the three, not from a weak store.
The definition problem is easy to see in public data. Shopify's 2026 article on mobile versus desktop reports a global all-device conversion average of 2.69% from one vendor, and a 3.4% desktop and 2.0% mobile split from another, with mobile at 70% of ecommerce traffic (Shopify). Weight the second pair by that 70% traffic share and you get 0.70 × 2.0% + 0.30 × 3.4% = 2.42%, not 2.69%. Neither number is wrong. They measure different samples, so a store that reads 2.5% is "above benchmark" against one and "below" against the other.
This guide gives the numbers that can be traced to a source, shows how to adjust a benchmark to your own device mix, and works one example through. It does not give a single "good" conversion rate, because no honest one exists. For how conversion rate itself is calculated, see ecommerce conversion rate.
Which ecommerce benchmarks can you trace to a source?
The figures below can be found on the linked page on the date shown. Read the last column before using any of them.
| Metric | Figure | Source and date | What it measures |
|---|---|---|---|
| Online share of US retail | 17.9% of total retail sales (seasonally adjusted), $347.3 billion | US Census Bureau, Q3 2026, released 2026-11-19 | Context only: how big ecommerce is, not how a store performs |
| Cart abandonment | 70.22% average; individual studies range from 55% to 84% | Baymard Institute, 50 studies 2006–2025, page dated 2026-10-28 | Share of carts that never become orders, averaged across different studies |
| Conversion, desktop | 3.4% | Contentsquare 2026 report, as cited by Shopify, 2026-08-10 | Desktop sessions that convert |
| Conversion, mobile | 2.0% | Same | Mobile sessions that convert |
| Mobile share of traffic | 70% | Same | Share of ecommerce traffic |
| Conversion, all devices | 2.69% | Dynamic Yield, as cited by Shopify | Global average, all devices |
| Conversion, food and beverage | about 5.5% | Dynamic Yield, as cited by Shopify (2025) | Vertical average |
| Conversion, luxury and jewelry | below 0.9% | Dynamic Yield, as cited by Shopify (2025) | Vertical average |
Two things stand out. The vertical spread is roughly six to one (5.5% against under 0.9%), so a vertical average that does not match your catalogue is close to meaningless. And Baymard's own studies range from 55% to 84%, so a single "70%" tells you little about whether your 67% is good.
How do you adjust a benchmark to your own device mix?
A store with a different share of mobile traffic than the benchmark sample should not compare against the headline number. Reweight the benchmark instead:
Expected conversion = mobile share × mobile benchmark + desktop share × desktop benchmark
With the 2.0% mobile and 3.4% desktop figures above:
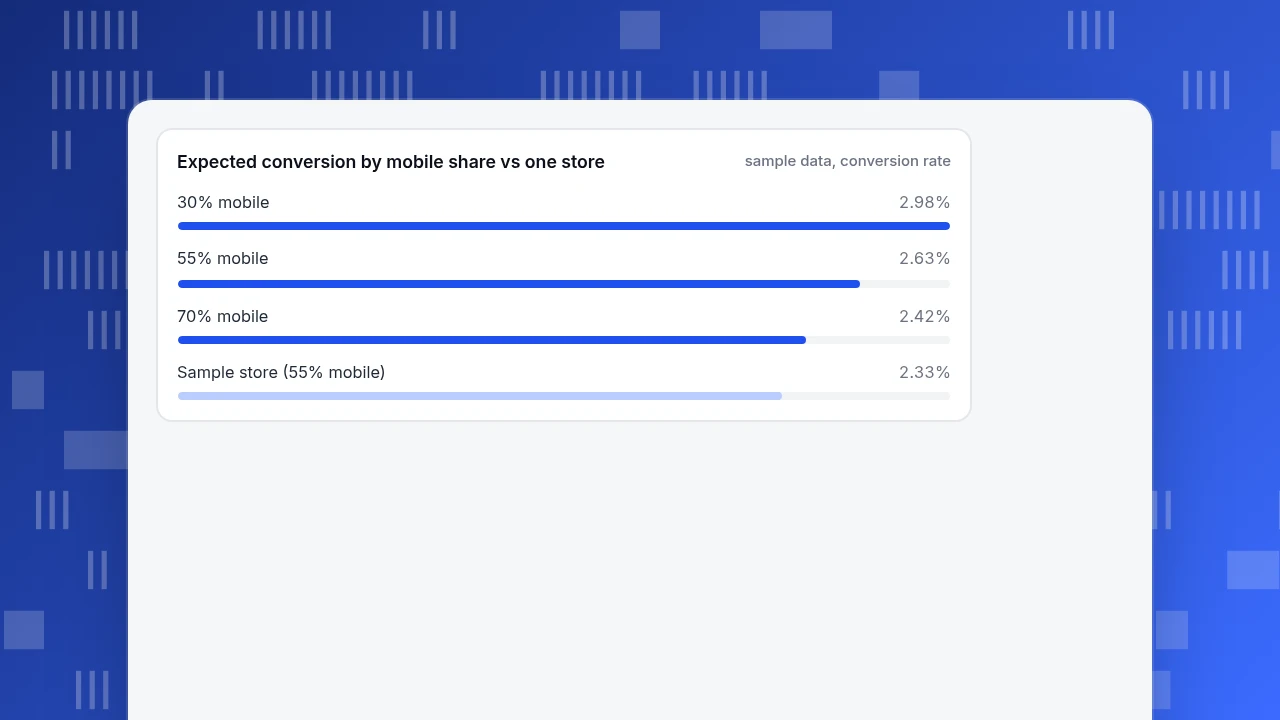
- At a 70% mobile share: 0.70 × 2.0% + 0.30 × 3.4% = 2.42%.
- At a 55% mobile share: 0.55 × 2.0% + 0.45 × 3.4% = 2.63%.
- At a 30% mobile share: 0.30 × 2.0% + 0.70 × 3.4% = 2.98%.
A store whose audience skews desktop should expect almost a full point more than a mobile-heavy store at the same quality. If you skip this step you are comparing audience mix, not store quality.
| Mobile share of sessions | Expected conversion | Calculation |
|---|---|---|
| 30% | 2.98% | 0.30 × 2.0% + 0.70 × 3.4% |
| 55% | 2.63% | 0.55 × 2.0% + 0.45 × 3.4% |
| 70% | 2.42% | 0.70 × 2.0% + 0.30 × 3.4% |
Uses 2.0% mobile and 3.4% desktop from Contentsquare's 2026 report as cited by Shopify (2026-08-10). The same store at the same quality should expect a lower blended rate as its mobile share grows.
Worked example: one store against the benchmarks
Sample data: an online store had 120,000 sessions last month, 55% of them on mobile. Its average order value is $68.
| Device | Sessions | Orders | Conversion | Benchmark | Gap |
|---|---|---|---|---|---|
| Mobile | 66,000 | 1,122 | 1.7% | 2.0% | −15.0% |
| Desktop | 54,000 | 1,674 | 3.1% | 3.4% | −8.8% |
| Total | 120,000 | 2,796 | 2.33% | 2.63% (mix-adjusted) | −11.4% |
The arithmetic: 66,000 × 1.7% = 1,122 orders and 54,000 × 3.1% = 1,674, so 2,796 orders ÷ 120,000 = 2.33%. The mix-adjusted benchmark at a 55% mobile share is 2.63%, which would have produced 3,156 orders. The gap is 360 orders a month, or 11.4%.
Three readings follow:
- Against the 2.69% headline the same store looks 13.4% behind. Reweighting for device mix narrows the gap to 11.4%, which is the fairer number.
- The gap is larger on mobile (−15.0% against −8.8% on desktop), so mobile is where to look first. Revenue per session is 2.33% × $68 = $1.58.
- At $68 per order, 360 missing orders is $24,480 a month, but only if the benchmark is the right target. Treat it as an upper bound on the prize, not a forecast.
Cart abandonment gets the same treatment. Say the store had 9,000 carts and 2,970 became orders. Abandonment is 1 − 2,970 ÷ 9,000 = 67.0%, which is 3.2 points under Baymard's 70.22% average. That looks good, but only if your definition of "cart" matches the studies'. If your store counts a cart only after an item has been added from the product page, and a study counted "initiated checkout", the two rates are not comparable.
Expected conversion by mobile share vs one store
sample data, conversion rateWhat is inside the 70% cart abandonment figure?
Baymard's reasons list helps you decide which part of your own funnel to inspect. Excluding shoppers who were just browsing (42% of US online shoppers in the survey), the reasons given for abandoning were:
| Reason | Share |
|---|---|
| Extra costs (shipping, tax, fees) too high | 40% |
| Delivery too slow | 20% |
| Did not trust the site with card details | 19% |
| Site required account creation | 18% |
| Checkout too long or complicated | 17% |
| Website errors or crashes | 17% |
Source: Baymard Institute, page dated 2026-10-28. The shares add up to 131%, so shoppers gave more than one reason and the rows overlap. Two consequences follow. First, a share of abandoned carts is people who were never going to buy, so a 0% abandonment target is meaningless. Second, the biggest single reason (extra costs) is visible in your own data before you spend on anything: compare the checkout step where shipping appears with the step before it.
How do you build a benchmark of your own?
Published numbers give you a range. Your own history gives you the target. Build it in four steps:
- Fix the definition once. Write down what divides what (orders ÷ sessions, or purchasing visitors ÷ visitors) and use that every time. Switching mid-year breaks every comparison.
- Compare like with like. Same device mix, same traffic source group (paid, organic, email), same period. A December month is not comparable with a June month.
- Use last year's same period as the main comparison and a published range as a sanity check, not a target.
- Report a range. "2.2–2.5% over the last four weeks, against 2.4–2.7% a year earlier" is a statement you can defend; "2.33%" alone is not.
Common mistakes with ecommerce benchmarks
- Comparing a visitor rate with a session rate. A visitor-based rate typically reads higher than a session-based one for the same traffic, because repeat visits collapse into one visitor.
- Using a vertical average that does not fit your catalogue. A store of mixed products can be nowhere near either end of a six-to-one vertical spread.
- Averaging over one season. Holiday traffic changes both the mix and the intent.
- Counting bots. Automated traffic in the denominator lowers your rate and makes you look worse than the benchmark.
- Treating the gap as the plan. A benchmark shows where to look; it does not say the gap can be closed.
How to measure your ecommerce metrics in TapCub
The example above runs on three TapCub reports, and it makes the definition problem explicit because TapCub's goal conversion rate divides by unique visitors in the selected dates, not by sessions.
- Set the goal that means an order. In Web analytics › Goals, create a goal for your purchase event or confirmation page. The same data appears in All-platform analytics › Business › Goals, which can also add revenue when you turn on revenue tracking.
- Read the device split. Open Web analytics › Audience, click a device type to add it as a filter, then open Web analytics › Sources to see conversions for that device. Select the goal under All-platform analytics › Business › Goals to see the device breakdown for that goal.
- Keep bots out of the denominator. TapCub counts recognised bots and AI crawlers separately (Web analytics › Bots), so the visitor count behind your conversion rate is people.
- Check the definition before you compare. The goal rate is visitor-based. If a benchmark is session-based, compare orders ÷ sessions yourself from the same period, or note that your visitor-based rate will read higher.
- Mark changes. Add an annotation under Configuration › Annotations for a price change, a shipping-cost change or a new checkout, so the following weeks are read against a labelled date.
TapCub does not supply benchmarks or tell you which vertical you belong to; it gives you your own device-level numbers on a stable definition, which is what the comparison needs.
FAQ
What is a good ecommerce conversion rate?
There is no single figure. One 2026 source cited by Shopify puts desktop at 3.4% and mobile at 2.0%, another puts the all-device global average at 2.69%, and vertical averages run from about 5.5% for food and beverage to under 0.9% for luxury. Compare yourself against your device mix and your own history.
What is the average cart abandonment rate?
Baymard Institute's average across 50 studies is 70.22%, with individual studies from 55% to 84%. Part of that is shoppers who were just browsing: 42% of US online shoppers in Baymard's survey said so.
Is mobile conversion lower than desktop?
In the figures Shopify cites from Contentsquare's 2026 report, yes: 2.0% on mobile against 3.4% on desktop, while mobile is 70% of ecommerce traffic. Mobile-heavy stores should therefore expect a lower blended rate than the headline average.
How much of retail is ecommerce?
The US Census Bureau estimated that ecommerce was 17.9% of total US retail sales (seasonally adjusted) in the third quarter of 2026, or $347.3 billion, up 10.4% from a year earlier. This describes the market, not a store's performance.
Why do different sources give different conversion rates?
They divide different things (visitors, sessions or orders), sample different stores, and cover different periods. Check the definition and sample before comparing, and adjust for device mix.
Sources
- US Census Bureau, "Quarterly Retail E-Commerce Sales": Q3 2026, $347.3 billion, 17.9% of total retail, released 2026-11-19. https://www.census.gov/retail/ecommerce.html (checked 2026-11-20)
- Baymard Institute, "Cart abandonment rate statistics": 70.22% average across 50 studies, 55–84% range, reasons for abandonment. https://baymard.com/lists/cart-abandonment-rate (checked 2026-11-20)
- Shopify, "Mobile vs desktop conversion rates" (2026-08-10), citing Contentsquare's 2026 report and Dynamic Yield: 3.4% desktop, 2.0% mobile, 70% mobile traffic, 2.69% global average, vertical averages. https://www.shopify.com/blog/mobile-vs-desktop-conversion-rates (checked 2026-11-20)
Was this article helpful?
We use your answers to fix and expand this page.
Couldn’t send. Please try again in a minute.
Thanks for the feedback. We’ll use it to improve this page.You’ve already sent feedback on this page. Thanks.

Customer Experience Consultant
Writes about live chat, visitor conversations, and self-service, sharing practical ways to make customer communication clearer and more effective.