Try it on your own data
Every report in this article is in the free plan. One snippet for web and apps, up to 10 sites.
Start freeBehavioral segmentation examples are only useful if you can rebuild them: each segment needs an action, a time window and a count. In a sample of 20,000 online-store visitors, repeat buyers (2 or more orders in 90 days) bought again at 18.7% against 5.2% for browsers, and power users (8 or more active days) at 24.6% against 2.7% for dormant ones.
What you will learn
- Write every segment as did or did not, in N days, M times, and record its size next to it
- Rates differ by 3.6× (repeat buyers vs browsers) and 9.3× (power vs dormant users), but power users are only 3.2% of people
- Prioritise by size times expected lift: a 1-point gain in 7,415 light users (+74 buyers) beats a 2-point gain in 1,237 repeat buyers (+25)
What makes a behavioral segment concrete
An example of behavioral segmentation only helps if you can rebuild it. "Loyal customers" is a label. "Placed 2 or more orders in the last 90 days" is a segment: it names an action, a time window and a count, so anyone with the same data gets the same people. Every example below is written that way, with a definition, a size and one outcome to compare.
The idea of grouping customers by what they do goes back at least to Wendell Smith's 1956 paper on market segmentation, and Russell Haley's 1968 paper added the benefit people seek as a basis. For the full definition and the four common types, see behavioral segmentation; for the choice of variables, see behavioral segmentation variables. This article is the worked version, with numbers.
The dataset behind the examples
Sample data: an online store with 20,000 identified visitors, meaning people who logged in at least once in the last 90 days, so their actions can be tied together. The data was generated in Python with a fixed seed and holds, for each person, the number of orders in 90 days, the number of active days in the last 30, the number of wishlist items, and whether they bought in the following 30 days.
Of the 20,000, 1,448 bought in the next 30 days (7.24%). That is the baseline every segment is compared with. A segment is interesting only if its rate differs from 7.24% by more than chance would explain.
For readers who want to check: comparing two segments uses the two-proportion z-test described in the NIST/SEMATECH handbook. The three headline comparisons below (repeat buyers against browsers, power against dormant, savers against non-savers) give z = 18.4, 25.9 and 16.5, far outside what chance produces.
Purchase segments
Purchase behavior looks at what, how much and how recently people buy. This example uses orders in the last 90 days.
| Segment | Definition | People | Share | Bought in next 30 days |
|---|---|---|---|---|
| Repeat buyers | 2 or more orders in 90 days | 1,237 | 6.2% | 231 (18.7%) |
| One-time buyers | Exactly 1 order | 3,856 | 19.3% | 368 (9.5%) |
| Cart, no order | Added to cart, 0 orders | 2,435 | 12.2% | 197 (8.1%) |
| Browsers | No cart, no order | 12,472 | 62.4% | 652 (5.2%) |
Shares are rounded and may not add to exactly 100%. The four rows add up to 20,000 people and 1,448 later buyers.
Repeat buyers buy again at 3.6 times the rate of browsers (18.7 ÷ 5.2). They are 6.2% of people and 16.0% of next-month buyers (231 ÷ 1,448). The "cart, no order" segment is the one most teams write a rule for first, and at 8.1% it is barely above the 7.24% average, so a reminder to everyone in it will mostly reach people who were never close to buying.
| Segment | Definition | People | Bought in next 30 days |
|---|---|---|---|
| Repeat buyers | 2 or more orders in 90 days | 1,237 (6.2%) | 231 (18.7%) |
| One-time buyers | Exactly 1 order | 3,856 (19.3%) | 368 (9.5%) |
| Cart, no order | Added to cart, 0 orders | 2,435 (12.2%) | 197 (8.1%) |
| Browsers | No cart, no order | 12,472 (62.4%) | 652 (5.2%) |
Sample data: 20,000 identified visitors over 90 days; overall rate 7.24% (1,448 buyers).
Usage-frequency segments
Usage frequency groups people by how often they show up. This example uses active days in the last 30, where an active day is any day with at least one session.
| Segment | Definition | People | Share | Bought in next 30 days |
|---|---|---|---|---|
| Power | 8 or more active days | 639 | 3.2% | 157 (24.6%) |
| Regular | 3 to 7 active days | 4,634 | 23.2% | 601 (13.0%) |
| Light | 1 or 2 active days | 7,415 | 37.1% | 496 (6.7%) |
| Dormant | 0 active days | 7,312 | 36.6% | 194 (2.7%) |
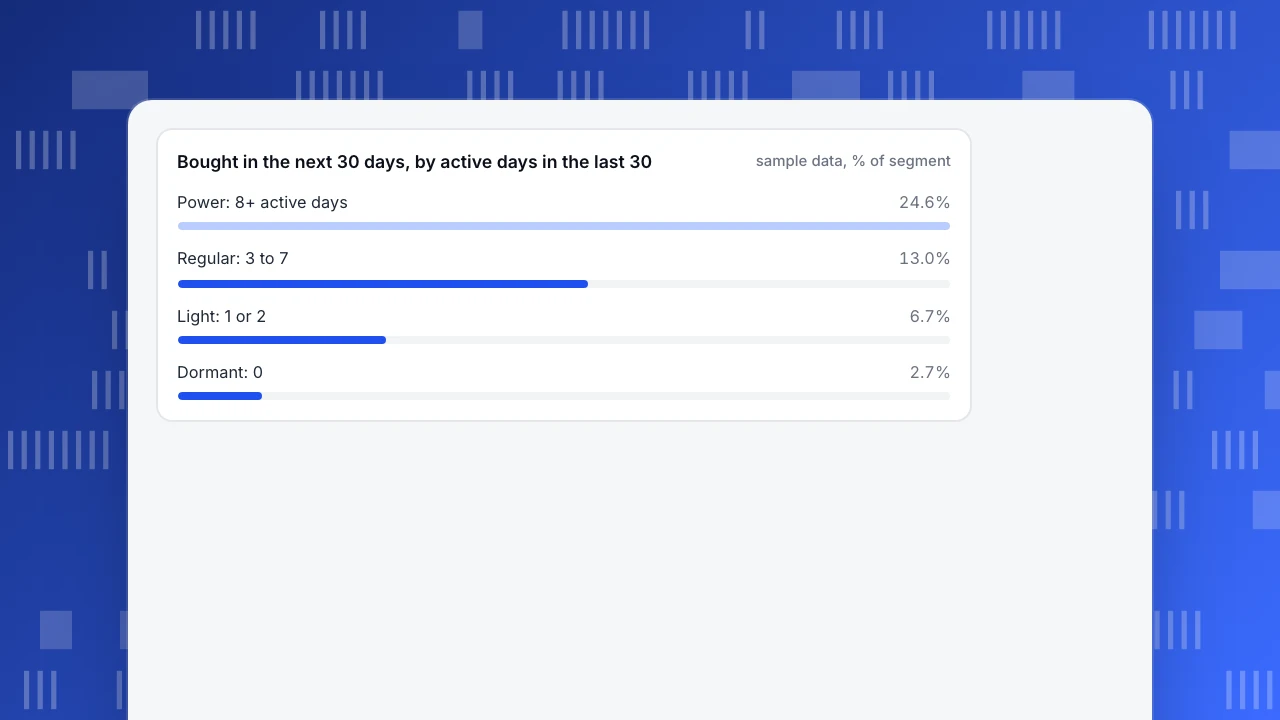
The gap between the top and bottom is large: power users buy at 9.3 times the rate of dormant ones. But the groups are very different in size. Power users are 3.2% of people and only 157 of the 1,448 later buyers (10.8%); the light segment is more than eleven times larger, and a one-point gain there is worth more than a ten-point gain in the power group (see the prioritisation section).
Active-day thresholds are a choice. Cut them where your own data shows a jump in the outcome rather than at round numbers.
Bought in the next 30 days, by active days in the last 30
sample data, % of segmentEngagement segments
Engagement segments use a specific action that signals interest. This example uses saving items to a wishlist.
| Segment | Definition | People | Share | Bought in next 30 days |
|---|---|---|---|---|
| Wishlist savers | 1 or more wishlist items | 2,757 | 13.8% | 408 (14.8%) |
| No wishlist | 0 items | 17,243 | 86.2% | 1,040 (6.0%) |
Savers buy at 2.5 times the rate of non-savers. Splitting savers into "1 to 2 items" and "3 or more" gave 1,565 people (15.8% bought) and 1,192 people (13.5%), a gap within noise (z = 1.7), so the extra split adds no information. Keep a split only when the outcome differs; two segments with the same rate and the same message are one segment.
Other engagement rules built the same way: read three or more help articles, used search, opened the pricing page twice, watched more than half of a product video.
How the segments overlap
Each person belongs to one segment per dimension, and to one in each of the three at once. The overlaps carry the most useful information.
- Power users with no order. 202 of the 639 power users (31.6%) placed no order in 90 days. They visit often and do not buy: a pricing, shipping or stock problem is more likely than a motivation problem. Look at what they view before leaving.
- Dormant people who did buy. 783 people had no active day in the last 30 but at least one order in the last 90. They bought once and left; a different message from "you have items in your cart" is needed.
- Repeat buyers who went dormant. 80 of the 1,237 repeat buyers (6.5%) had no active days. These are the small group that is most expensive to lose.
Name a combined segment with the rule, not with a nickname: "2 or more orders in 90 days and 0 active days in 30".
Which segment to act on first
Size matters as much as the rate. A simple estimate: extra buyers = people in the segment × the lift you expect.
| Segment | People | Assumed lift | Extra buyers |
|---|---|---|---|
| Cart, no order | 2,435 | +2 points | 49 |
| Light usage | 7,415 | +1 point | 74 |
| Repeat buyers | 1,237 | +2 points | 25 |
The lifts are assumptions for illustration, not forecasts. Use them to decide where a test is worth running: the biggest segment with a modest, believable lift often beats the most responsive small one. Use these rules:
- If a segment is under 100 people, do not build a program around it. Ad platforms apply a similar floor: Google Ads requires more than 100 active users in a segment before it can run ads to it.
- If two segments have the same rate, merge them.
- If a rule needs a window you cannot explain, drop it. Everything must read "did or did not, in N days, M times".
- Hold out a random 10% of the segment when you message it, so you know whether the message changed anything. The segment's rate before the message is not evidence that the message works.
How to check that a segment is real
A segment predicts; it does not cause. Repeat buyers buy more often partly because they already like the store. Before you build on a segment, check three things:
- Does the gap survive a different window? Recompute with 60 and 120 days. If the ranking changes, the segment is fragile.
- Is the gap larger than chance? Run the two-proportion test as above. With a few hundred people, a gap of a few points is often noise.
- Does it hold over time? Compare the same segment's outcome in two separate months.
Building these segments in TapCub
TapCub defines and measures segments; it does not send emails, messages or discounts. To rebuild the examples above:
- In All-platform analytics › Users › Segments & tags, create a rule segment. Conditions include did or did not do an event, a property value, first seen, active, and being in another segment. Start with "did the order event in the last 90 days" and "did not" for the cart-no-order and browser groups. A rule segment refreshes daily or on demand. The 2-or-more split is easiest from the RFM segment on the same page, which scores purchase frequency from your order event.
- Create the usage and engagement segments the same way. People count is kept for 30 days as a trend, so you can see whether a segment is growing.
- Anonymous visitors have no profile and never enter a segment. For the people in the example, send the login with
tapcub.loginso the actions join one profile. - Use a segment as a group in a funnel or in retention in All-platform analytics › Behavior › Behavior analysis, for example the share of cart-no-order people who later buy.
- RFM sorts people into 10 groups such as champions and at risk, using quintile scores, and records movements between groups; the example's fixed thresholds are your own rules, not RFM's. The lifecycle chart splits people into New, Returning, Resurrecting and Dormant each week or month.
FAQ
What are examples of behavioral segmentation?
Purchase behavior (repeat buyers versus one-time buyers), usage frequency (power versus dormant users), engagement actions (wishlist savers) and lifecycle stage (new, returning, dormant). Each example above gives the rule, the size and the outcome.
How many behavioral segments should I have?
Few enough that each has a different message and a size you can act on. In the examples, three segmentation dimensions with 2 to 4 groups each is plenty; split further only when the outcome differs.
What is the difference between behavioral and demographic segmentation?
Behavioral segments are based on what people did; demographic ones on who they are, such as age or location. In this example, behavior separates later-buyer rates from 2.7% to 24.6%, while demographics were not in the data and are not needed to build the rules.
Is RFM a behavioral segmentation?
Yes. RFM scores people by how recently they bought, how often and how much. It is one specific purchase-behavior method with set groups.
Can I do this without a CRM?
Yes, if your analytics tool records the actions and identifies logged-in users. The rules need events, a window and a count, not a customer database.
Sources
- Smith, W. R. (1956). Product Differentiation and Market Segmentation as Alternative Marketing Strategies. Journal of Marketing, 21(1), 3–8.
- Haley, R. I. (1968). Benefit Segmentation: A Decision-Oriented Research Tool. Journal of Marketing, 32(3), 30–35.
- NIST/SEMATECH e-Handbook of Statistical Methods, 7.3.3 Comparing two proportions: the z-test used to compare segment rates. Checked 2026-11-21.
- Google Ads Help, About your data segments: a segment needs more than 100 active users to be eligible to run ads. Checked 2026-11-21.
Was this article helpful?
We use your answers to fix and expand this page.
Couldn’t send. Please try again in a minute.
Thanks for the feedback. We’ll use it to improve this page.You’ve already sent feedback on this page. Thanks.

Product Experience Specialist
Writes about product experience, practical workflows, and growth, turning complex processes into clear steps for everyday decisions.