Try it on your own data
Every report in this article is in the free plan. One snippet for web and apps, up to 10 sites.
Start freeA normal bounce rate is the one your own site shows for the same type of traffic, measured with one fixed definition. Public ranges swing from about 20% to 90% because sites differ and tools define a bounce differently. Compare channels and devices to your own baseline, and act only when a segment moves more than chance explains.
What you will learn
- The same sessions give 42%, 40% or 27% bounce depending on the definition, so compare only numbers from one tool
- Channel mix alone moved the blended rate from 47.8% to 50.1% in the sample while no page changed
- With 500 sessions a segment's rate can move about 4.4 points by chance; act on bigger moves in bigger segments
Why there is no single normal bounce rate
If you search for a normal bounce rate you will find tables that say e-commerce is 20-45%, content sites 40-60% and landing pages 70-90%. The tables disagree with each other because three things differ from site to site: what the tool calls a bounce, what kind of page the visit started on, and where the visitor came from. A number from one table tells you little unless all three match your site.
Google's own documentation shows how much the definition matters. In Google Analytics 4, a session is engaged when it lasts longer than 10 seconds, has a key event, or has 2 or more page or screen views. Bounce rate is the inverse of engagement rate: the share of sessions that were not engaged. That is a different rule from the older "one page and out" idea, and it gives lower numbers on the same traffic.
Scale also differs. Contentsquare's 2026 Digital Experience Benchmark covers 99 billion sessions across 6,500 websites in 9 industries, and reports that 61% of visits to product detail pages bounce. That is a useful sign that landing on a single product page and leaving is common, but the report does not use your definition, so do not treat 61% as a target for your own product pages.
Three definitions on the same traffic
Take 10,000 sessions of sample data. Of them, 4,200 viewed exactly one page. Among those 4,200 single-page sessions, 200 fired a custom event, 1,300 stayed longer than 10 seconds, and 200 hit a key event (no overlap, to keep the arithmetic clean).
- Single-page rate: 4,200 ÷ 10,000 = 42.0%.
- One page view and no custom event: (4,200 − 200) ÷ 10,000 = 40.0%.
- Not engaged (GA4-style): (4,200 − 1,300 − 200) ÷ 10,000 = 27.0%.
Same visitors, three honest answers, a 15-point spread. If one report says 27% and another says 42%, neither is wrong. They are measuring different things. Pick the definition that matches the question you are asking, write it down, and never mix numbers from two tools in one chart.
A practical rule: use the single-page rate when the page has one job and a second click is the goal (a pricing page that should lead to signup). Use the not-engaged version when reading time is itself the goal (an article), because a visitor who reads for three minutes and leaves is not a failure.
| Definition | What counts as a bounce | Sample result |
|---|---|---|
| Single-page rate | Session with exactly one page view | 4,200 of 10,000 = 42.0% |
| TapCub bounce | One page view and no custom event | 4,000 of 10,000 = 40.0% |
| GA4 bounce | Session that was not engaged: 10 seconds or less, no key event, fewer than 2 views | 2,700 of 10,000 = 27.0% |
Sample data: 10,000 sessions, 4,200 single-page; of those, 200 fired a custom event, 1,300 lasted longer than 10 seconds and 200 had a key event, with no overlap.
How channel and device change your baseline
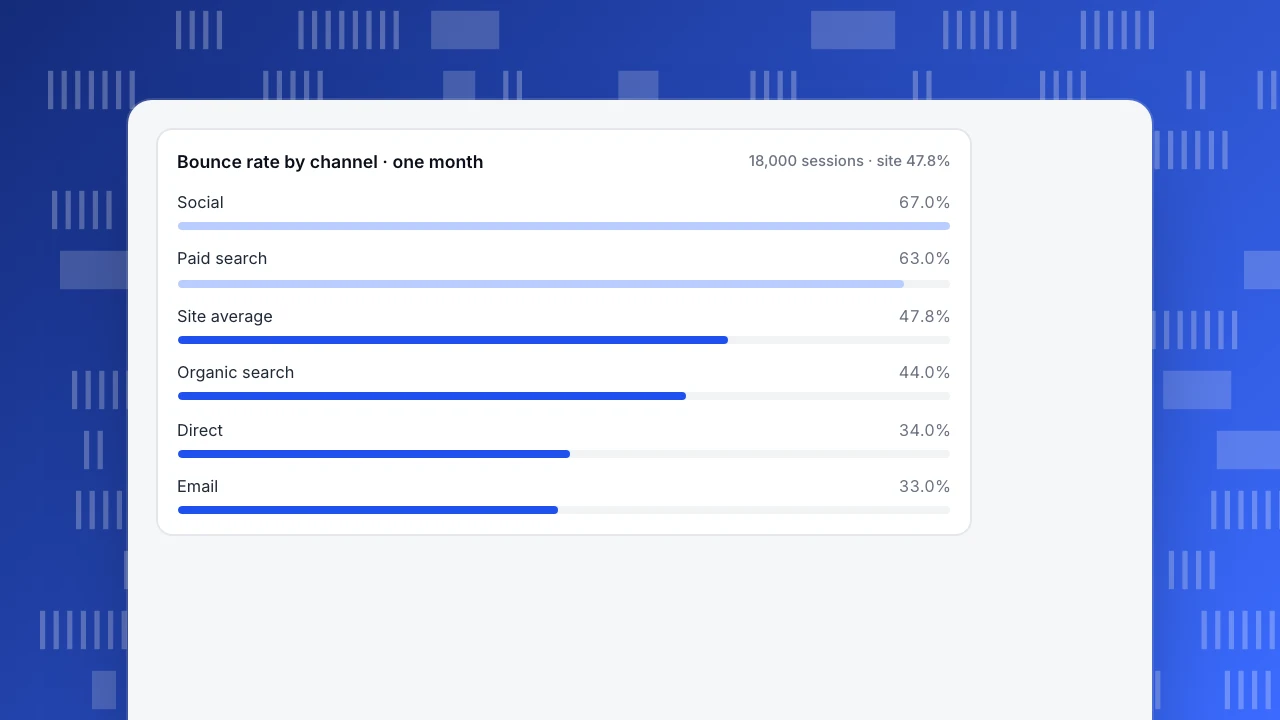
Visitors from different sources arrive with different intent, so each channel has its own normal. In the sample month below, 18,000 sessions produced 8,600 bounces, a blended 47.8%:
| Channel | Sessions | Bounced | Bounce rate |
|---|---|---|---|
| Organic search | 8,000 | 3,520 | 44.0% |
| Paid search | 3,000 | 1,890 | 63.0% |
| Social | 2,500 | 1,675 | 67.0% |
| 1,500 | 495 | 33.0% | |
| Direct | 3,000 | 1,020 | 34.0% |
| Total | 18,000 | 8,600 | 47.8% |
Now suppose a social campaign doubles social sessions to 5,000, and every channel keeps its own rate. Social then contributes 3,350 bounces, the total becomes 10,275 of 20,500, and the site-wide rate rises to 50.1%. That is +2.3 points with no page changed. A manager looking only at the blended number would go hunting for a page problem that does not exist.
Devices split in the same way. In the same month, mobile had 5,616 bounces in 10,800 sessions (52.0%) and desktop 2,984 in 7,200 (41.4%). Mobile visitors often arrive from social apps and are checking something quickly, so a gap like this is common and not by itself a design fault. The question to ask is whether the gap is growing.
Bounce rate by channel · one month
18,000 sessions · site 47.8%What public benchmarks can and cannot tell you
Use a published benchmark for one thing only: to find out whether your number is in a plausible range, not to grade yourself. Before you use any, check four things:
- Definition. Does it say whether bounce means single-page or not engaged? If it does not say, the number cannot be compared with yours.
- Page type. A benchmark for whole-site averages says little about a single landing page or a blog post, where a high bounce rate is expected because the visitor got the answer.
- Traffic mix. A benchmark for organic traffic does not fit a site that is mostly paid.
- Bots. Automated visits are usually one-page and add to the bounce count. If the tool does not separate them, its benchmark is inflated.
The benchmark that always applies is your own: the same segment, the same definition, over the last 8 to 13 weeks.
Is a change in bounce rate real?
Small segments move by chance. For a rate p measured on n sessions, a rough 95% band is 1.96 × √(p(1−p) ÷ n). At p = 50%:
| Sessions in segment | Band (± points) |
|---|---|
| 200 | 6.9 |
| 500 | 4.4 |
| 2,000 | 2.2 |
So a social segment of 200 sessions that goes from 60% to 65% is inside the noise. A site-wide segment of 2,000 sessions that moves from 44% to 49% is not. This is a rule of thumb for independent sessions, not a significance test, but it is enough to stop you reacting to every wobble.
Decision rules
Write the following rules down once for your team:
- Only judge segments of 500 or more sessions. Merge small ones (for example all "other" referrers) until they reach that size.
- Compare with your own baseline. Use the median of the last 8 to 13 weeks for that segment and definition.
- Investigate when a segment moves by more than its noise band and stays out of it for two consecutive weeks.
- Check the mix first. If channel shares moved, recompute the blended rate with last period's shares before touching any page.
- Then look at the page. If one entry page's bounce is rising while the same page's traffic mix is stable, look at load speed, a changed headline, or a broken element.
- Leave expected high-bounce pages alone (articles, contact details, store hours) unless a second goal on them is missing.
Pages that should bounce and pages that should not
A bounce is only a problem relative to what the page is for. Compare the bounce rate with the goal rate on the same page before you conclude anything.
Sample data for one month:
| Page | Sessions | Bounced | Bounce rate | Goal completions | Goal rate |
|---|---|---|---|---|---|
| Blog article | 3,000 | 2,340 | 78.0% | 120 newsletter sign-ups | 4.0% |
| Pricing page | 800 | 304 | 38.0% | 96 trial starts | 12.0% |
| Campaign landing page | 1,200 | 888 | 74.0% | 36 sign-ups | 3.0% |
Read the three rows differently:
- The blog article bounces at 78.0% and still turns 4.0% of readers into subscribers. Visitors read, got the answer and left, or subscribed. Pushing its bounce rate down is not the goal; pushing the sign-up rate up is.
- The pricing page bounces at 38.0% and converts 12.0%, so it is doing its job of sending people on. If its bounce rate climbed to 55%, you would want to know why.
- The campaign landing page bounces at 74.0% and converts 3.0%. It looks like the blog, but it was paid for to produce sign-ups. Compare it with the same page on other campaigns and with its ad copy before blaming the page.
The lesson: the same bounce rate means different things on different pages. Write the expected range per page type in your own baseline, with the goal that justifies it.
If the bounce rate is real, look for these causes
Once a change survives the noise band and the mix check, work down this list in order. Each cause leaves a different trace.
| Cause | Trace in your data | First check |
|---|---|---|
| Slow first load | Mobile bounce much higher than desktop on the same page | Page speed on mobile; the main image or script that loads last |
| Message mismatch | High bounce from one campaign or keyword, normal elsewhere | Ad or search snippet against the headline the visitor lands on |
| Broken or blocked content | Sudden jump on one page after a release | Script errors, a missing image or an interstitial covering the page |
| Wrong audience | Bounce high on one channel at all hours | The targeting or the referring page's promise |
| Page already answered the question | High bounce with a good goal rate | Nothing; this is working |
Fix the cause with the clearest trace first. If mobile bounce is 14 points above desktop on the same page, check speed before touching the copy. If one campaign bounces at 80% and its siblings at 55%, change the campaign, not the site.
How to read bounce in TapCub
Take the sample month above and look at it in TapCub.
- Open Web analytics › Overview for the blended bounce rate, then Web analytics › Sources to see bounce by channel, referrer and UTM. This is where a social surge shows up as a mix change, not a page problem. Bots are counted separately, so their one-page visits do not inflate the rate.
- Open Web analytics › Audience for bounce by device type, browser and country, and new versus returning visitors side by side.
- Open Web analytics › Pages to see the bounce rate of each entry page next to its entries, so you can compare pages that get the same kind of traffic.
- Keep the definition in mind: TapCub counts a bounce as one page view and no custom event, and reports engaged rate separately (10 seconds, 2 pages, or a key event). Quote both when you compare with a GA4 number.
- In All-platform analytics › Operations › Monitors, create a monitor on
bounce_ratefor a segment you care about. Use the dry run, which tells you how many times it would have fired in the past 30 days, to set a threshold above the noise band.
TapCub does not change your pages or tell you why a visitor left. It shows which segment moved and when, so you can decide where to look.
FAQ
What is a normal bounce rate?
There is no single figure. With a single-page definition, content pages and landing pages often sit well above 60%, while pages that lead to a second step usually sit lower. Judge a segment against your own last 8 to 13 weeks, using one definition.
Is a 70% bounce rate bad?
Not automatically. For a blog post or a contact page, 70% can mean visitors found what they needed. For a checkout step or a pricing page that should lead somewhere, it is a flag. Look at the goal of the page, the channel, and whether the number changed.
Why is my bounce rate different in two tools?
The tools use different rules. GA4 treats a session as a bounce only if it was not engaged (10 seconds or less, no key event, fewer than 2 views). Others count any one-page session. Bots, sampling and session timeouts add further differences.
Should I try to get my bounce rate as low as possible?
No. Lowering bounce by adding a pop-up or splitting an article across pages can improve the number and hurt the visitor. Set a target for the goal the page serves (signups, reads, calls) and treat bounce as a diagnostic for pages meant to lead somewhere.
How often should I check bounce rate?
Weekly is enough for most sites. Daily numbers swing with traffic mix and small samples, so judge a segment over a week once it has 500 or more sessions.
Sources
Was this article helpful?
We use your answers to fix and expand this page.
Couldn’t send. Please try again in a minute.
Thanks for the feedback. We’ll use it to improve this page.You’ve already sent feedback on this page. Thanks.

Data Analyst
Explores traffic sources, conversion funnels, and retention, using clear metric definitions and concrete examples to explain what the numbers mean.