You pay for ads but can't tell which channel brings orders
Marketing attribution and channel ROI. Click IDs from 14 ad platforms, UTM and first touch are matched to orders and revenue.
See channel ROIAnalyze user data, drive business growth. Web, app and mini-program traffic and behavior in one place — and when something's wrong, talk to the visitor who's still on the page.
Live visitors, sources, pages and funnels on one screen. Humans and bots are counted separately, so the numbers stay honest.
31%
bots removed
#3
ChatGPT source
<1 min
to first data
Reports in this view
Example scenario: a store owner finds 31% of “visitors” were crawlers — and ChatGPT is now the #3 source.
Visitors
48,213
▲ 12.4% vs. previous
Pageviews
162,940
▲ 8.1%
Bounce rate
38.2%
▼ 2.3 pts
Live now
128
humans only
Visitors · daily
This periodPreviousTop sources
| Page | Visitors | Pageviews | Avg. time | Bounce |
|---|---|---|---|---|
| / | 18,402 | 24,118 | 1m 12s | 41% |
| /pricing | 9,286 | 12,471 | 2m 04s | 26% |
| /blog/ga4-alternative | 7,654 | 8,910 | 3m 48s | 62% |
| /features | 5,811 | 7,402 | 1m 51s | 33% |
Funnels, retention and paths built from the events you already collect. Click a step to see who left and where they went next.
−46%
cart → checkout
2.4×
returning vs. new
2h 14m
median to pay
Reports in this view
Example scenario: a product team sees returning users convert 2.4× better — and the drop is on mobile.
Conversion by step
Window: 7 days100%
42.0%
22.7%
16.3%
Step 2 → 3 · who dropped
Median time to convert
2h 14m
| Segment | Entered | Paid | Conversion | Median time | Trend |
|---|---|---|---|---|---|
| All users | 10,000 | 1,630 | 16.3% | 2h 14m | |
| Returning | 3,120 | 1,048 | 33.6% | 38m | |
| New | 6,880 | 582 | 8.5% | 3h 02m | |
| From Google Ads | 2,414 | 426 | 17.6% | 1h 50m | |
| From ChatGPT | 812 | 193 | 23.8% | 1h 05m | |
| Mobile Safari | 3,966 | 301 | 7.6% | 4h 12m |
One profile per user, across website, mini-program and app. Devices and sessions before and after login are merged automatically.
3 → 1
IDs merged
1,206
Champions, live
41%
revenue · 6% users
Reports in this view
Example scenario: a growth lead sees “Champions” are 6% of users but 41% of revenue, and builds a win-back list.
Lena M.
Berlin · first seen 64 days ago
Timeline
All platformsWeb · Viewed "Linen shirt"
Mon 09:12 · from Google Ads · Safari, iPhone
Mini-program · Added to cart
Mon 20:41 · shared by a friend
Mini-program · Paid $86
Mon 20:44 · logged in → profiles merged
App · Repeat order $112
Sat 11:05 · push campaign "Autumn"
Chat · Asked about returns
Tue 14:30 · resolved by AI, 2 messages
Web · Opened newsletter "Autumn"
Thu 08:15 · clicked "Linen collection" · MacBook
App · Left a 5-star review
Sun 19:20 · segment updated → Champions
Segment · Champions
Live · 1,206 usersAd click IDs, UTM tags and first touch are recognized automatically. Import costs and see ROI per channel next to revenue.
14
ad platforms
6.2×
top channel ROI
$23.5
cost per order
Reports in this view
Example scenario: a marketer shifts 20% of TikTok budget to the newsletter after seeing 0.8× vs. 6.2× ROI.
Blended ROI
2.8×
▲ 0.3 vs. Aug
Cost per order
$23.5
▼ $2.1
Attributed revenue
$29,310
▲ 18%
| Channel | Matched by | Cost | Clicks | Orders | Revenue | ROI |
|---|---|---|---|---|---|---|
| Newsletter | utm | $400 | 3,118 | 58 | $2,480 | 6.2× |
| Google Ads | gclid | $4,200 | 12,640 | 212 | $14,280 | 3.4× |
| Meta Ads | fbclid | $3,100 | 8,905 | 96 | $6,510 | 2.1× |
| Microsoft Ads | msclkid | $900 | 2,210 | 27 | $1,620 | 1.8× |
| TikTok Ads | ttclid | $2,600 | 9,480 | 31 | $2,080 | 0.8× |
| ChatGPT | AI referral | — | 4,212 | 44 | $2,340 | organic |
First touch vs. last touch
Top landing pages
Every conversation shows where the visitor came from, what they're looking at and how they got there — straight from analytics.
8.4%
convert after chat
4
messages to close
9
languages, live
In this view
Example scenario: a support lead answers a German shopper in English, sees the €74 cart, closes in four messages.
Jonas W. DE
On /checkout · 3m 12s
Visitor context
This visit
/ (home)
/shirts/linen
/cart
/checkout
Past chats · 2
Return policyAI · 4 days ago
Size guideMia · 2 weeks ago
Tags & notes
Last order
#4821 · Linen shirt ×2€58 · 12 d ago
Trademarks belong to their respective owners and indicate compatibility only.
Four problems we hear every week — and what TapCub does about each one.
Marketing attribution and channel ROI. Click IDs from 14 ad platforms, UTM and first touch are matched to orders and revenue.
See channel ROIRetention and segments. See which cohorts return, which features they use, and who is about to churn.
Week-1 → week-6 retention, two cohorts
See retentionHumans and bots counted separately. Search engines, AI crawlers and bad bots get their own reports.
See bot filteringLive chat with visitor context. Reach out while they're still on the page, with their source and journey in view.
See live chatSimple reports anyone on the team can read — with the details analysts need one click away.
≈2 KB
script, gzipped
12
reports out of the box
197
bot rules built in
Visitors
12,480
▲ 9.2%
Avg. time
2m 48s
▲ 14s
Bot share
31%
excluded from reports
Channels
Top pages
Live visitors · 128
updates every 5sHumans vs. bots · today
Humans69% · 8,611
Search engines14%
AI crawlers11%
Bad bots6%
197 rules · 5 detection layers
New users
3,912
▲ 6.8%
DAU
18,604
▲ 3.1%
Crash-free users
99.7%
last 7 days
Day-1 retention by week
Versions
| Channel | Installs | Day-1 | Day-7 | Paying |
|---|---|---|---|---|
| App Store search | 1,482 | 44% | 19% | 4.1% |
| Google Play | 1,106 | 39% | 15% | 2.8% |
| Website → app | 764 | 61% | 34% | 7.9% |
| Paid install | 560 | 28% | 9% | 1.2% |
Visits
26,118
▲ 11.0%
New users
5,370
▲ 4.6%
From shares
1,284
new users
Entry scenes
Share chain · "Autumn sale"
Share → order rate 13.8%
| Page | Visits | Avg. stay | Exit | Shares |
|---|---|---|---|---|
| pages/index | 14,206 | 42s | 31% | 812 |
| pages/product | 9,118 | 1m 18s | 24% | 1,406 |
| pages/cart | 3,672 | 38s | 41% | 0 |
| pages/order | 2,210 | 55s | 12% | 0 |
Behavioral and user analytics without a tracking plan or a data team.
Find the step where users drop, how long each step takes, and which segment converts best.
One person across devices and platforms, merged before and after login.
Any event, any breakdown, with formulas.
Did new users come back?
Where users go before and after a step.
Rules, RFM and live-updating groups.
Clicks and scroll depth per page.
AI names captured events; you confirm.
Attribution, ROI and a growth board that tells you what to fix first.
Ad click IDs, UTM and first touch, matched to sign-ups and orders automatically.
Import costs and compare cost, conversion and revenue on one quadrant chart.
Acquisition, activation, retention, revenue and referral — with alerts when something moves.
Ad click IDs we recognize
No extra setup — just keep the IDs in your landing URLs.
gclid · fbclid · msclkid · ttclid · li_fat_id · twclid · bd_vid · gdt_vid · clickid
Explore marketing analyticsMost tools do either analytics or chat. TapCub runs both on the same visitor data — so the funnel that shows the drop can open the conversation that fixes it.
or pick any step
Checkout funnel · today
Drop alert · cart → checkout−46%Product
2,400
Cart
1,248
Checkout
674
Paid
508
Live visitors · 128
filter: /checkoutVisitor context
This visit
/shirts/linen
/cart
/shipping
/checkout · 3:12
Agent · Jonas W. DE
OnlineChat started from Live visitors · context attached
Chatted
8.4%
conversion
Didn't chat
2.1%
conversion
Support · just now
Hallo Jonas — der Versand nach Deutschland ist ab 60 € kostenlos (3–5 Tage). Kann ich helfen?
Before
With TapCub
After the conversation, compare conversion of visitors who chatted vs. those who didn't. See chat attribution
Plain-language questions, answered with a chart and a one-line conclusion.
Try a question
A scripted demo — no real AI is called on this page.
Metrics AI is watching
Sign-ups · daily, last 14 days · split by device
Sign-ups fell 38% on Tue–Thu. The drop is only on mobile Safari: the form's submit error rate jumped from 2% to 41% after Monday's release. Desktop was flat.
ROI by channel · last 30 days
Newsletter returns $6.20 per $1. Google Ads drives the most revenue; TikTok Ads spends 23% of budget for 7% of orders — consider moving part of it.
At-risk users · no activity in 14+ days
1,206 users show churn signals. Most never invited a teammate. Saved as segment "At risk · no invite" — ready for a campaign or a chat invite.
Chat topics · last 30 days · 1,842 conversations
Shipping time is 31% of all chats — and 68% of them start on /checkout. Adding delivery estimates to that page could remove roughly 390 chats a month; AI already answers 74% of these.
Autocaptured clicks and forms grouped into named events for you to confirm.
Get notified by email, Slack, Lark, DingTalk, WeCom or webhook when a metric moves.
Answers common questions from your knowledge base and hands off to a person when unsure.
10 industry templates and 11 industry solutions, each with the metrics and dashboards that matter for your business.
Track checkout drop-off, which channels bring paying customers, and how many come back — then greet shoppers on the checkout page.
Conversion rate
3.2%
Avg. order value
$68
Repeat rate
27%
Channel ROI
2.8×
Typical question: "Why is mobile checkout 2× worse than desktop?" → Funnel by device shows the address form; a chat invite on that step recovers 8% of carts.
Attribute overseas ad spend, see visitors by country and time zone, and chat in their language with two-way translation.
Countries
42
Ad ROI
2.4×
Chat languages
9
Inquiry → order
11%
Typical question: "Which countries convert from Meta ads?" → Country × channel table shows DE and NL at 3.1×, BR at 0.6×.
See which features drive activation, which accounts are healthy, and who is ready to upgrade.
Trial → paid
14%
Activation
46%
Week-4 retention
38%
Health score
72
Typical question: "Which feature predicts upgrade?" → Users who invite a teammate in week 1 upgrade 2.4× more often.
Measure reading depth and member conversion, and see exactly how much AI crawlers take from your content.
Read depth
64%
Member conversion
1.8%
AI crawler hits
82,410
Decaying articles
12
Typical question: "How much of our traffic is AI crawlers?" → 19% of requests this month; GPTBot alone fetched 2,140 articles and sent back 812 readers.
Follow leads from first visit to sign-up, track course completion and see who renews.
Lead conversion
6.5%
Trial lessons
920
Completion
58%
Renewal
41%
Typical question: "Which course pages produce leads?" → Landing page report ranks 14 pages by form conversion; chat on the top 3 adds 112 leads a month.
Measure the account-opening funnel step by step, flag risky traffic, and keep data handling compliant.
Application rate
4.1%
KYC completion
63%
Funded accounts
38%
Bot traffic
27%
Typical question: "Where does KYC lose people?" → Step 3 (ID upload) loses 29%, mostly Android Chrome; the compliance center keeps every event in region.
Track installs, retention and paying users by version and channel.
Day-1 retention
41%
Day-7 retention
17%
Paying users
3.6%
ARPPU
$9.8
Typical question: "Did the 2.3 update hurt retention?" → Version comparison shows D1 dropped 6 pts on Android only; crash-free users fell to 97.1%.
Measure form conversion and inquiries by channel, then see the cost of every qualified lead.
Form conversion
7.9%
Cost per lead
$14
Chat inquiries
316
Qualified
48%
Typical question: "Which ads bring leads that actually close?" → Channel report with "qualified" as the goal shows Google at $19 per qualified lead, Meta at $41.
Events processed today1,284,906Sample
Honest numbers don't require tracking people across the web. TapCub counts visitors without cookies and gives you the controls regulators expect.
Visitors are counted with a salted, daily-rotating server-side hash. Nothing is stored in the browser.
Crawlers never inflate your visitor counts or conversion rates — they get their own report.
GDPR, CCPA and China's PIPL modes, with consent settings per site.
Export any time, delete on request. Member roles and audit logs for your team.
Compliance mode
ActiveConsent banner preview
We use analytics without cookies. Enable live chat to store a session cookie?
Data requests
Export · all events (CSV)Export
Delete visitor · hash 7f3a…Delete
Audit log · 3 membersView
| Audit log | Member | Action | When |
|---|---|---|---|
| Privacy settings | Mia K. · Owner | Enabled "Truncate IP addresses" | Today 09:12 |
| Data request | Jonas R. · Admin | Deleted visitor hash 7f3a… (GDPR art. 17) | Yesterday 16:40 |
| Members | Mia K. · Owner | Invited lea@… as Analyst (read-only) | Sep 29 |
Illustrative customer scenarios — written from the perspective of the people who use analytics and live chat every day. Not real reviews.
The first thing TapCub showed me was that 31% of our "visitors" were crawlers. Our conversion rate didn't drop — it had never been that low. Now the numbers I report are numbers I trust.
R. K.
Store owner · DTC fashion
A visitor had been on checkout for three minutes. I saw her cart, her source, and opened a chat. She bought. That's the whole product in one moment.
M. S.
Support lead · cross-border store
We never wrote a tracking plan. Autocapture collected the clicks, AI named them, I confirmed six events in the inbox. Funnels worked the same afternoon.
J. L.
Product manager · B2B SaaS
The ROI quadrant settled a two-month argument in one meeting: TikTok was costing 23% of budget for 7% of orders.
A. P.
Performance marketer · agency
Our visitors write in German, Japanese and Spanish. I answer in English and nobody notices. Translation runs both ways and stays out of the way.
D. H.
Founder · 2-person export business
Two kilobytes, no cookie banner for analytics, and the install took longer to read about than to do. Lighthouse didn't move.
T. N.
Front-end developer · media site
ChatGPT is our third-largest source now. We only know because TapCub puts AI assistants in their own channel instead of hiding them under "direct".
E. W.
Content lead · online publication
One profile per student across our site, mini-program and app. The retention chart finally shows people, not devices.
L. Z.
Growth · education platform
The anomaly alert reached Slack before our support queue did. Mobile sign-ups had broken after a release; we fixed it by lunch.
C. B.
Engineering manager · fintech
AI answers the shipping questions and hands the rest to me with the full conversation. Our first-response time went from minutes to seconds.
S. O.
Customer service · home goods
Analytics and live chat share one script. Turn chat on later in the console — nothing to install twice.
Free, no credit card. Email or Google.
Each one gets its own site key. Up to 10 on the free plan.
Before </head>, or via a plugin for WordPress, Shopify and Webflow.
<!-- before </head> · analytics + chat -->
<script defer src="https://static.pathclue.com/client.js" data-site="SITE_KEY"></script>
First event received · 2 seconds ago
pageview · / · Chrome, macOS · humans only
Realtime lights up
Visitors appear with the first pageview
Bots filtered
197 rules run before anything is counted
Chat when ready
One switch in Settings — no second script
SDKs and APIs
Same visitor ID across web, app and mini program — one person, one timeline. Server-side events go through the HTTP API.
Analytics and live chat each have a free plan with the core features included. Paid plans add volume, retention and team features — priced in USD.
Pay with
Analytics
$0 / month
Pro from $9 / month
Included free
On Pro
Live chat
$0 / month
Pro from $12 / month
Included free
On Pro
TapCub supports self-hosted deployment and an Enterprise edition — quoted separately for teams with security, compliance, data-sovereignty or customization needs.
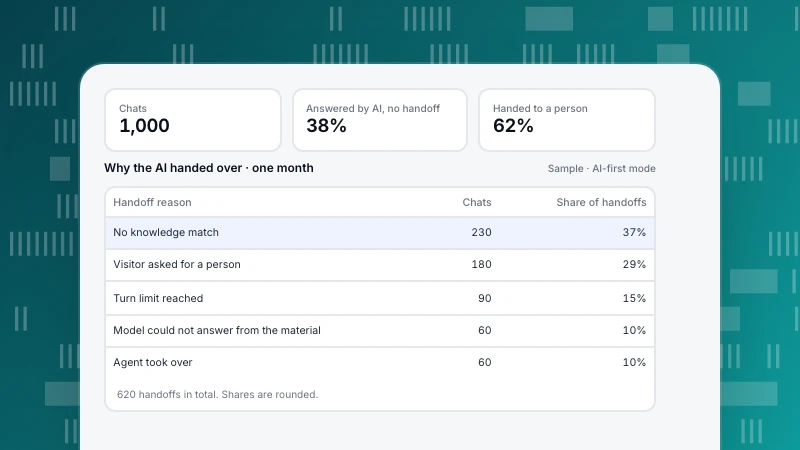
Blog · Live Chat
Chatbots differ most in how they produce an answer: fixed menus, keyword rules, stored FAQ matches, or generated text grounded in your documents. The main types compared, how retrieval-augmented AI works, and what a support bot actually resolves.
9 min read
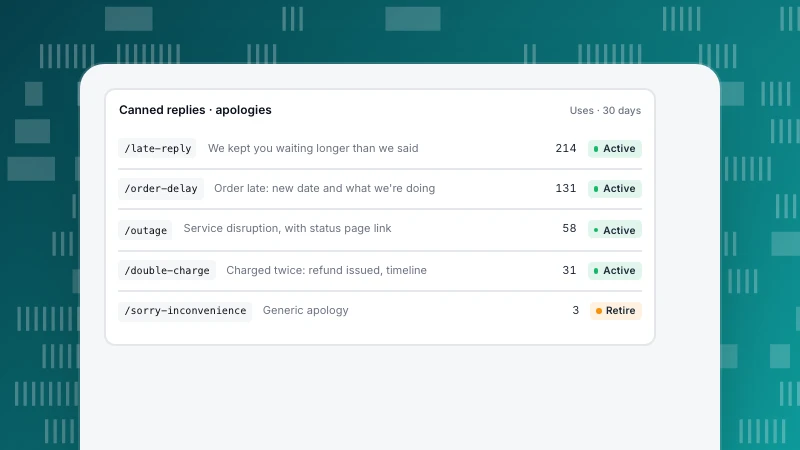
Blog · Live Chat
"Sorry for the inconvenience" sounds polite but often reads as a brush-off. Why, what a good apology actually contains, 36 alternatives by situation, and how to make better apologies the default for a support team.
9 min read
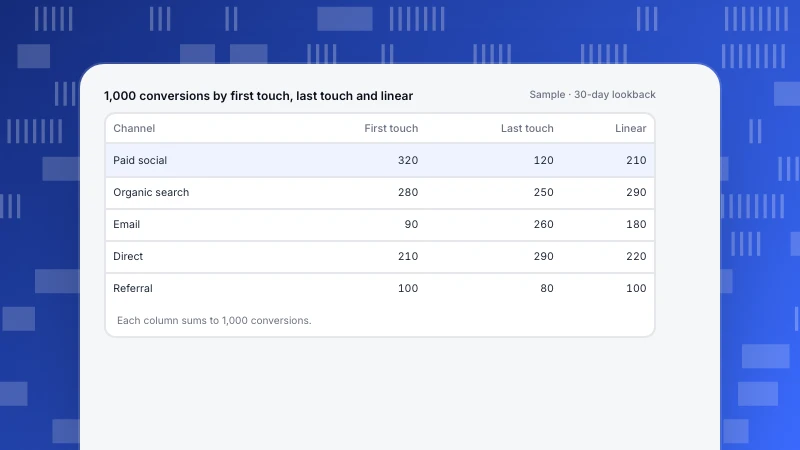
Blog · Analytics
Multi-touch attribution shares the credit for a conversion across the touchpoints that led to it. Every common model applied to the same journey with numbers, how channel rankings change between models, what MTA cannot measure, and how to set it up.
8 min read
Changelog · September 2026
See everything we've shipped, release by release.
Updated continuously
Usually within a minute of installing the script. The realtime view shows visitors as soon as the first pageview arrives.
For most websites, yes: sources, pages, funnels, retention and realtime are all included, and bots are filtered out. You can run both side by side while you compare.
No. The core script is about 2 KB gzipped and loads asynchronously. Live chat and autocapture load only when you turn them on.
Analytics doesn't set cookies or store identifiers in the browser — visitors are counted with a salted hash on the server. In most regions that means no cookie banner for analytics.
Yes. One project can connect a website, apps and mini-programs, and the same user is merged across platforms after login. App and mini-program sources are available from the Pro plan.
No. Live chat runs on the same script as analytics. Turn it on in the console and the chat widget appears.
It depends on your plan: 6 months on Free, 12 on Pro and 24 on VIP. Need longer? Enterprise retention is set by contract. See pricing.
Yes. The Enterprise edition can be deployed on your own servers or private cloud and is quoted separately. Learn about Enterprise.
Every click, backed by data. Install one line of code and see your first numbers in a minute.
No credit card · Free plans for analytics and chat · Cookieless analytics