Quick answer
A scroll map is a report that shows how far down a page visitors scroll: each band is the share of visits that reached that height, so colors cool as fewer people go deeper, and a sharp drop marks where content stops being seen.
Formula: deepest point = (scrollY + window height) ÷ page height; reach at depth d = visits with deepest point ≥ d ÷ all visits
What is a scroll map?
A scroll map is a report that shows how far down a page visitors scroll. It is drawn over the page as colors or as horizontal bands, and each band tells you the share of visits that reached that height. The warmest part sits at the top, where every visit starts; the colors cool as fewer people scroll deeper, and the point where they cool sharply is where attention falls off.
A scroll map answers one question: how much of this page do people actually see? It does not show what they clicked (that is a click map) or what they did next. For the single-number version, see scroll depth.
How scroll reach is calculated
A scroll map is built from one number per visit: the deepest point that visit reached. In a browser, that point is the distance scrolled plus the height of the visible window, taken as a share of the full page height. MDN documents the pieces: window.scrollY is how far the page has scrolled, and Element.scrollHeight is the full height of the content including parts not visible.
Deepest point = (scrollY + window height) ÷ page height
The map then counts, for each height, the visits whose deepest point was at least that far. Two consequences:
- The numbers can only go down. Reaching 75% means you also reached 50% and 25%, so each band is less than or equal to the one above. This is called reach, and it differs from "stopped here".
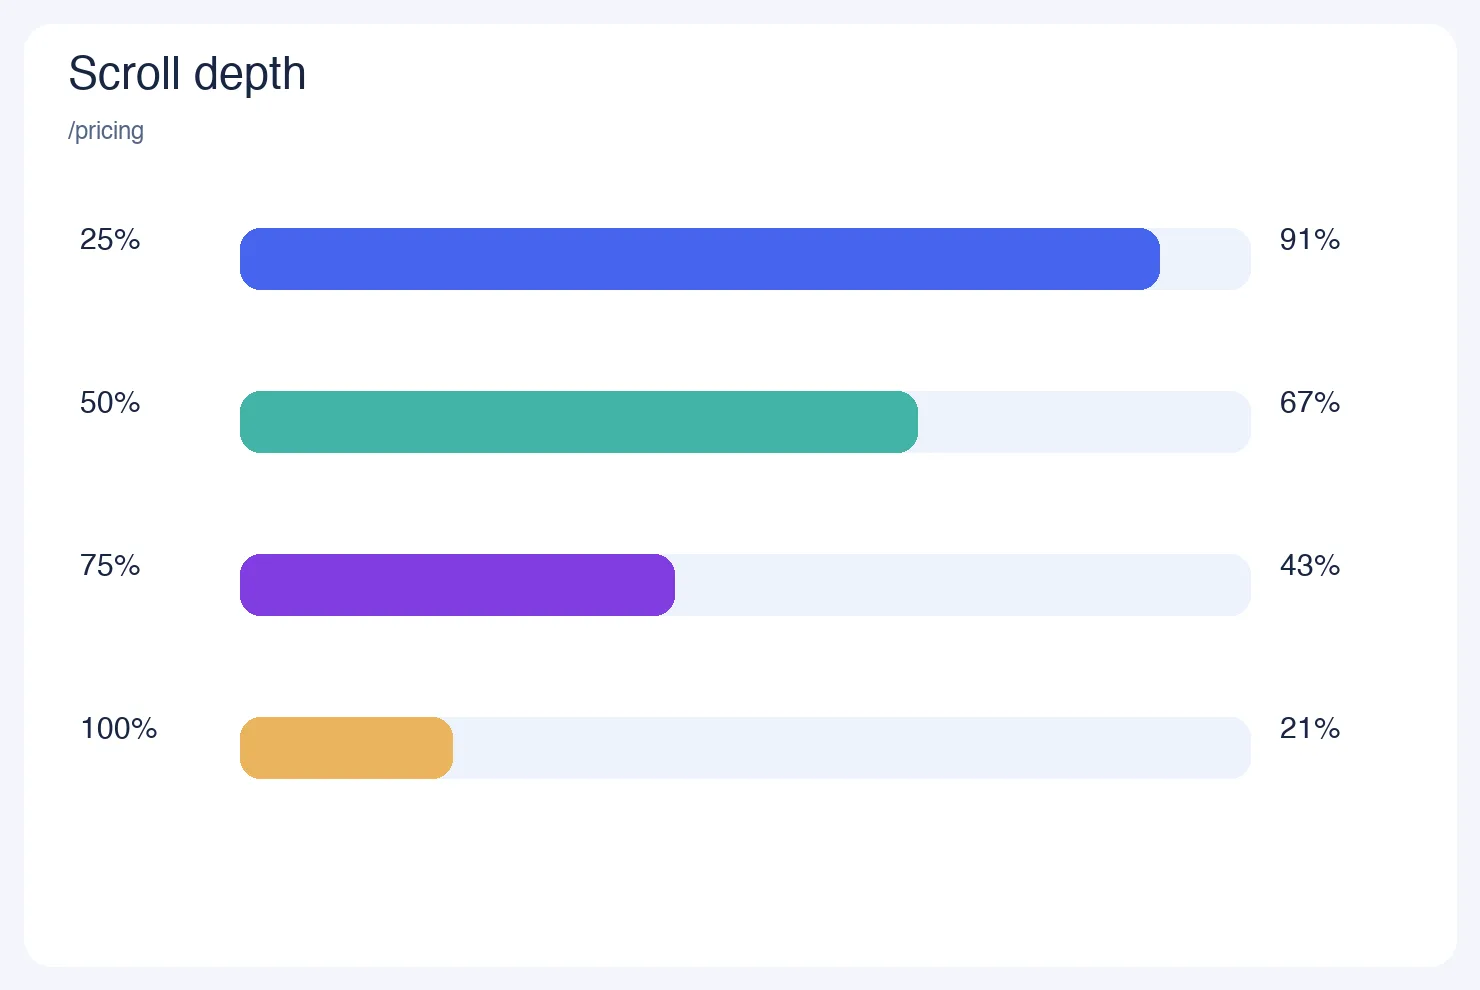
- Even the first band can be below 100%. In the example below, 91% of visits reached the 25% mark, so 9% never got a quarter of the way down.
How to read a scroll map: a worked example
Sample data: a pricing page received 2,000 visits. The page is 4,800 pixels tall, and the typical laptop window shows 800 pixels.
| Depth reached | Share of visits | Visits (of 2,000) | Lost since previous band | Relative loss |
|---|---|---|---|---|
| 25% | 91% | 1,820 | 9 points (180 visits) from the top | 9% |
| 50% | 67% | 1,340 | 24 points | 26.4% |
| 75% | 43% | 860 | 24 points | 35.8% |
| 100% | 21% | 420 | 22 points | 51.2% |
How to read it:
- Find the fold. 800 ÷ 4,800 = 16.7% of the page is visible without scrolling. Everything above it is seen by almost every visit.
- Find the steepest loss. In points, the drops are similar (24, 24, 22), but relative to who was still there, the loss grows: 26.4%, then 35.8%, then 51.2%. The weakest section is between 50% and 75%, where more than a third of the remaining visitors leave.
- Put your key elements on the map. If the pricing table starts at 62% of the page height, interpolating between the 50% (67%) and 75% (43%) bands estimates that about 55% of visits reach it: 67 − (12 ÷ 25) × 24 = 55.5%. Moving it up to 30% would put it in front of about 86% (91 − (5 ÷ 25) × 24 = 86.2%), roughly 1.55 times as many visits.
Treat the interpolation as an estimate, not a forecast: more people seeing a block is not the same as more people acting on it. Test the change and compare conversions.
What the numbers mean in practice
There is no universal "good" scroll depth, because it depends on page length and purpose. Eye-tracking research from Nielsen Norman Group (120 participants, over 130,000 fixations, published 2018) found that people spent about 57% of their viewing time above the fold and 74% in the first two screenfuls. Use that as a reason to check the top of your page first, not as a target.
Rules of thumb for deciding what to do:
- If the main call to action sits below a band where most people have left, move it up or repeat it higher.
- If a long drop happens right after a big image or a large empty gap, the layout may signal "the page ends here". Fill the gap or add a visible next section.
- If reach stays high to the bottom (above 60% at 100%), the page is probably short or very engaging; check whether people also click, because scrolling is not the same as interest.
- If a section sits at the very bottom, such as a footer sign-up form, assume only the small share that reaches 100% will see it (21% in the example), and do not put anything essential there.
- If mobile and desktop differ a lot, read them separately: a page that is 4,800 pixels on a laptop can be three times as tall on a phone.
Scroll map vs click map vs heatmap
| Report | What it shows | Best for | Weak at |
|---|---|---|---|
| Scroll map | Share of visits reaching each page height | Where content stops being seen | What people do with what they see |
| Click map | Where clicks land on the page | Which elements attract action | Content that gets read but not clicked |
| Rage click map | Fast repeated clicks on one spot | Broken or misleading elements | Normal behavior |
| Session replay | One visit, played back | Why something went wrong | Seeing patterns across many visits |
"Heatmap" is the umbrella term; the scroll map is one view of it. Use the scroll map to decide where content goes, then use the click map to see whether it works.
Limits of scroll maps
- Reaching is not reading. Someone can scroll past a section in a second.
- Page height changes. Lazy-loaded content, cookie banners and expanding menus change the height, so bands from different days may not line up exactly.
- Averages mix devices. Always split by device before acting.
- Small samples wobble. With 200 visits, a 5-point difference is within noise; wait for a few thousand visits before redesigning.
Reading scroll reach in TapCub
Say you want to find out whether people see the pricing table on the page above.
- Turn collection on. Heatmaps need autocapture, which needs the Pro plan or higher. Enable Scroll depth in the autocapture settings (the scroll reach view stays empty until it is on). Pages can be limited with path patterns such as
/pricing/*. - Open the report. Go to All-platform analytics › Behavior › Heatmaps, pick the page row (rows are merged by path template), and choose a device: all, desktop, mobile or tablet.
- Read the Scroll reach tab. Each row is the share of visits that reached that depth or further, for a date range of up to 92 days. The page list also shows average maximum scroll depth when people leave.
- Compare with clicks. Switch to Clicks and Elements to see whether the section that is reached also gets clicked.
- Mark the change. After you move a block, add a note in Configuration › Annotations and compare reach before and after.
TapCub does not store a picture of the page; for a click overlay it needs a URL you can still open. Replay of individual sessions is a separate feature and is off by default.
Sources
- Nielsen Norman Group, Scrolling and Attention (15 April 2018).
- MDN Web Docs, Element: scrollHeight property.
- MDN Web Docs, Window: scrollY property.
Was this explanation clear?
We use your answers to fix and expand this page.
Couldn’t send. Please try again in a minute.
Thanks for the feedback. We’ll use it to improve this page.You’ve already sent feedback on this page. Thanks.

Technical Engineer
Focuses on tracking code, SDKs, and API integrations, with practical guidance on implementation checks and troubleshooting.