Quick answer
Data filtering in analytics is excluding records, such as your own team's visits, bots and test traffic, according to rules, either before storage (collection-time) or when a report is built (report-time), so that metrics describe the audience you mean to measure.
What is data filtering in analytics?
Data filtering in analytics means excluding records from your data, either before they are stored or when a report is built, according to rules you set. The goal is that the numbers describe the people you actually want to measure: customers and prospects, not your own team, automated traffic or a staging site. Filtering changes the denominator of almost every ratio, so a filter that is missing or wrong moves conversion rate, bounce rate and cost per visit at the same time.
There are two places a filter can act, and the difference decides how careful you must be. A collection-time filter drops the record before it is stored, so the data is gone for good. A report-time filter (a segment, a table filter or a view) hides records from one report but leaves them in the data, so you can change your mind later.
What kinds of data filters are there?
Most analytics filtering falls into six kinds. The table shows what each one removes, a typical rule, and whether it can be undone.
| Filter | What it removes | Typical rule | Reversible? |
|---|---|---|---|
| Internal traffic | Your own team, QA and office visits | Exclude an IP address or range, or a cookie set for staff | Depends on where it acts |
| Bots and crawlers | Automated visits | Known-bot lists, user-agent rules, behavior checks. See bot filtering | Depends on where it acts |
| Test and staging data | Visits to development or preview sites | Keep only your production hostnames | Collection-time: no |
| Spam referrals and unwanted sources | Fake referrers and junk campaigns | Exclude by referrer domain or source value | Report-time: yes |
| Paths and pages | Admin screens, login and checkout steps you do not want to count | Exclude paths such as /admin/* | Collection-time: no |
| Geography or device | A region or device class that is out of scope | Include or exclude by country or device type | Report-time: yes |
For the internal-traffic case in particular, see how to exclude internal traffic.
Collection-time vs report-time filtering
The choice of where a filter acts is a trade-off between cleanliness and safety.
| Collection-time filter | Report-time filter | |
|---|---|---|
| Data stored? | No, records are dropped | Yes, records stay |
| Mistake costs | Permanent data loss | A wrong report you can rebuild |
| Applies to history? | No, only new data | Yes, any period |
| Best for | Traffic you will never want: your own IPs, staging hostnames | Slices you may want back: a country, a spam source |
Google Analytics 4 shows how strict this can be. In its documentation, a data filter can be created in a Testing, Active or Inactive state; up to 10 data filters can exist per property; a filter can take 24 to 36 hours to take effect; and once it is applied "the effect on the data is permanent", so excluded data is never processed. Google recommends report filters when you only want to hide data. The practical lesson applies to any tool: test before you make a permanent filter active, and keep a note of what each one removes.
Why filtering matters: bots and your own team
Automated traffic is not a rare edge case. Imperva's 2025 Bad Bot Report, based on 2024 data and published on 15 April 2025, found that automated traffic accounted for 51% of all web traffic in 2024, and that malicious bots made up 37% of internet traffic. Those figures describe the large set of sites Imperva protects, not your own site, so your share may be far lower or higher, but they show why a bot filter is not optional if a report is meant to describe people.
Internal traffic matters for a different reason: it is small but wildly unrepresentative. Your team opens the pricing page, submits the checkout form with test data and reloads the site hundreds of times a week. A few hundred sessions of that behavior can distort a small site's conversion rate more than thousands of normal visits.
Worked example: before and after filtering
Sample data: a store's analytics report for one month, with raw numbers and then the numbers after filtering internal and bot traffic.
| Metric | Raw report | Internal traffic | Bots | After filtering |
|---|---|---|---|---|
| Sessions | 52,000 | 1,900 | 7,800 | 42,300 |
| Conversions | 910 | 60 | 0 | 850 |
| Conversion rate | 910 ÷ 52,000 = 1.75% | n/a | n/a | 850 ÷ 42,300 = 2.01% |
Work through it: 52,000 − 1,900 − 7,800 = 42,300 sessions remain, so 18.7% of the raw sessions were not customers (3.7% internal and 15.0% bots). The internal visits carried 60 test conversions, so the real conversions are 910 − 60 − 0 = 850. The conversion rate rises from 1.75% to 2.01%, a relative change of about 15%, with no change in how the store actually performs.
Two things to notice. First, filtering did not make the store better; it made the report truthful, and the raw 1.75% had understated performance because bots add sessions that can never convert. Second, the effects went in different directions: bots lowered the rate (many sessions, no conversions) while the test orders raised the conversions. A filter that fixes only one of them would still leave a wrong number.
How to set up filters safely
- List what you want to exclude and why. Write one line per rule: "office IP range, because QA submits test orders".
- Pick the layer. Use a collection-time filter only for traffic you will never want back. Use a report-time filter for anything you might want to look at later.
- Test first. If your tool has a testing mode, run it for a few days and look at what would be removed. If it does not, apply the rule to a copy of the report.
- Compare before and after. Check sessions, conversions and conversion rate, as in the table above. A filter that removes 40% of your traffic is either removing something large and real, or you had a big bot problem; find out which.
- Re-check after a change. New office IPs, a VPN, a new staging domain or a new crawler can all reopen the problem.
Common mistakes with data filtering
- Filtering on the outcome. Excluding "sources that do not convert" makes every remaining source look better. Filter by who is visiting, never by what they did.
- Permanent filter, no test. A mistyped IP range or path can remove real customers from every future report. Test, and write down what was set.
- Relying on IP rules alone. Remote staff, VPNs and mobile hotspots change addresses. Combine IP rules with a way to mark your own browser, such as an exclusion cookie.
- Forgetting the denominator. After filtering, last month's numbers are not comparable to this month's. Annotate the date a filter went live.
- Treating filtering as blocking. Analytics filtering cleans reports; it does not stop a bot from loading your pages or using your server resources.
Data filtering in TapCub
Take the example above and apply it in TapCub.
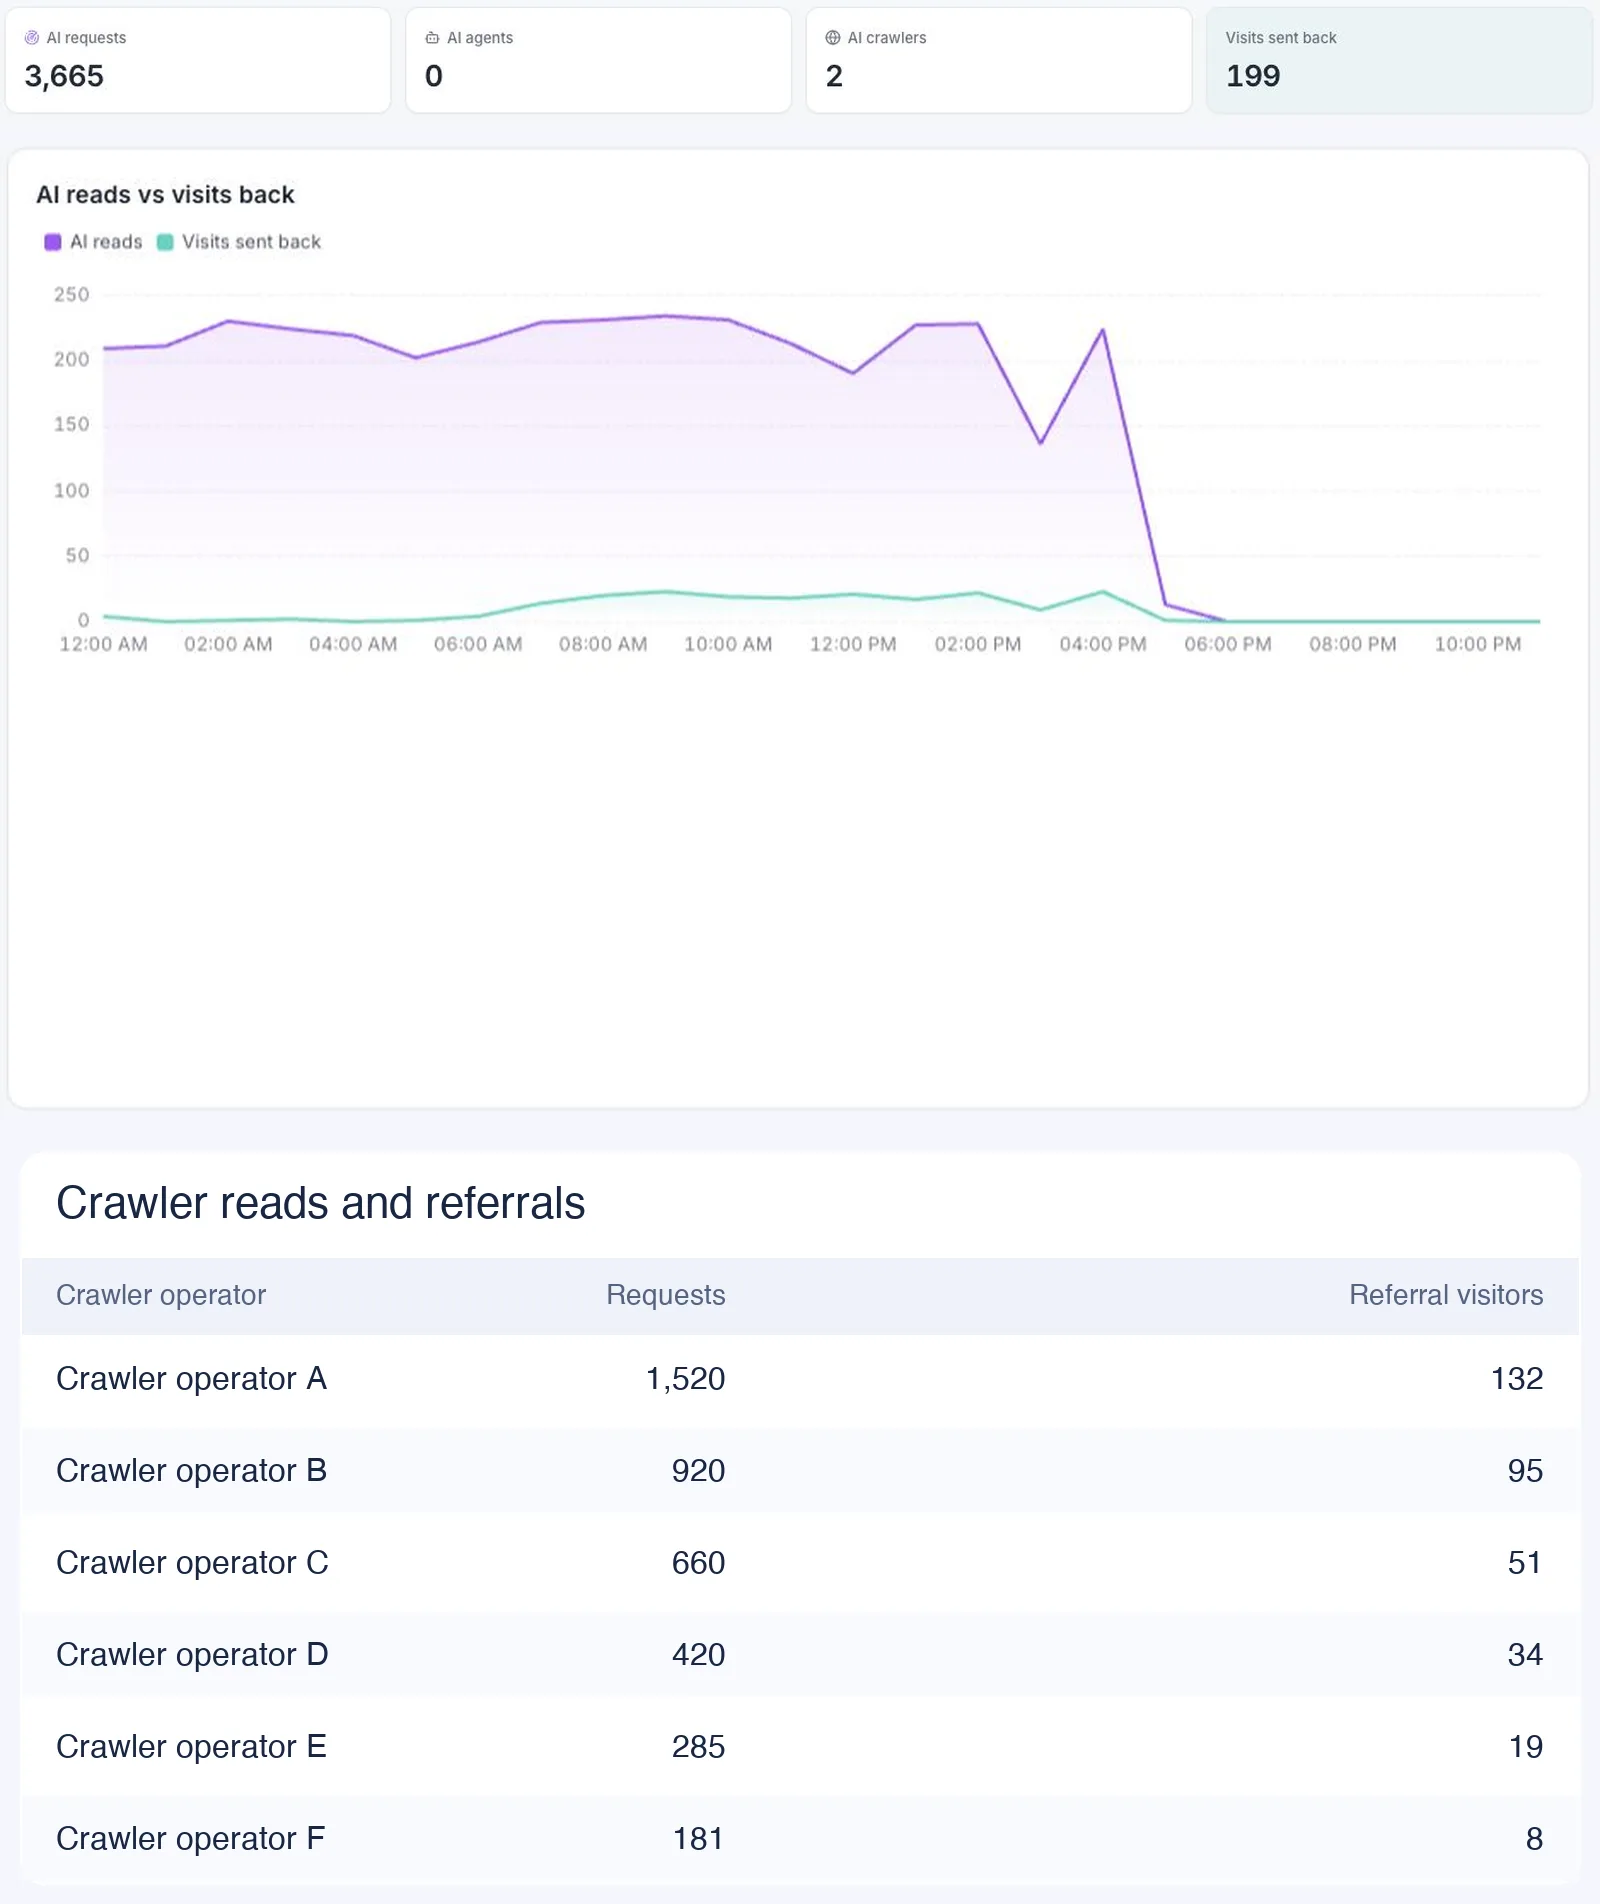
- Handle bots first. New projects default to Detect and report separately: recognized bots appear only in Web analytics › Bots and are excluded from human visitors, sessions and pageviews. The only way to mix them back in is the Do not detect setting, which is not recommended. With only the page script, you see only bots that execute JavaScript; a server event or log import covers the rest.
- Exclude your own team. On Web analytics › Configuration › Web settings, add an exclusion rule. Web rules can match address, path, hostname or user agent; click Exclude myself to store your current address. Test phones go on App analytics › Configuration › App settings as a device rule.
- Know which layer it is. Exclusion rules act at collection: a hit from an excluded address is dropped by the collector, and the change applies to new data only. Past sessions stay as they were, so annotate the date in Configuration › Annotations.
- Use report filters to look, not to delete. Clicking a row in a table adds that value as a header filter on the report and can be cleared. This is the report-time layer; it does not remove anything from storage.
- Verify. Open a page in the excluded browser and check Web analytics › Realtime; the visit should not appear.
Sources
- Google Analytics Help, Filter out internal traffic (10 data filters per property, 24 to 36 hours, permanent effect), checked 20 November 2026.
- Imperva, 2025 Imperva Bad Bot Report: How AI is Supercharging the Bot Threat (51% automated traffic, 37% bad bots, 2024 data), published 15 April 2025.
Was this explanation clear?
We use your answers to fix and expand this page.
Couldn’t send. Please try again in a minute.
Thanks for the feedback. We’ll use it to improve this page.You’ve already sent feedback on this page. Thanks.

Customer Experience Consultant
Writes about live chat, visitor conversations, and self-service, sharing practical ways to make customer communication clearer and more effective.